Bitcoin to USD ( BTCUSD ) Weekly Outlook , April 23 2020
BTCUSD Forecast and Technical Analysis & Fundamentals for Bitcoin
Introduction
The primary critical areas of interest on IQOption platform is the market price of $9219.13 resistance level and $3795.11 of 01 March ‘20 support level, respectively.
The war of coronavirus pandemic has had its impact on the bitcoin market, putting various institutions and traders into fear and uncertainty.
This week, we take a peek into the technical charts of the BTCUSD and touch on a few interesting fundamental events.
BTCUSD: Technical Analysis
Monthly Chart

Resistance:
BTCUSD has maintained its’ all-time high of $19666.00 of 1st December, 2017since its rise from May 2017.
A higher low (resistance) was established at $13880.00 on 1st June 2019 leading to a downtrend few months before the formation of support.
Support:
After the bearish run of BTCUSD price from 2017 into 2018, the Bulls pushed the price of bitcoin up from December 01, 2018, to June 01, 2019, where a new resistance was formed.
Price retested the (zone) low of previous low and sets a new low (support) at $3795.11 March 01, 2020, since then the price has been on the rise and currently at $ 7055.01 as at the time this report was compiled.
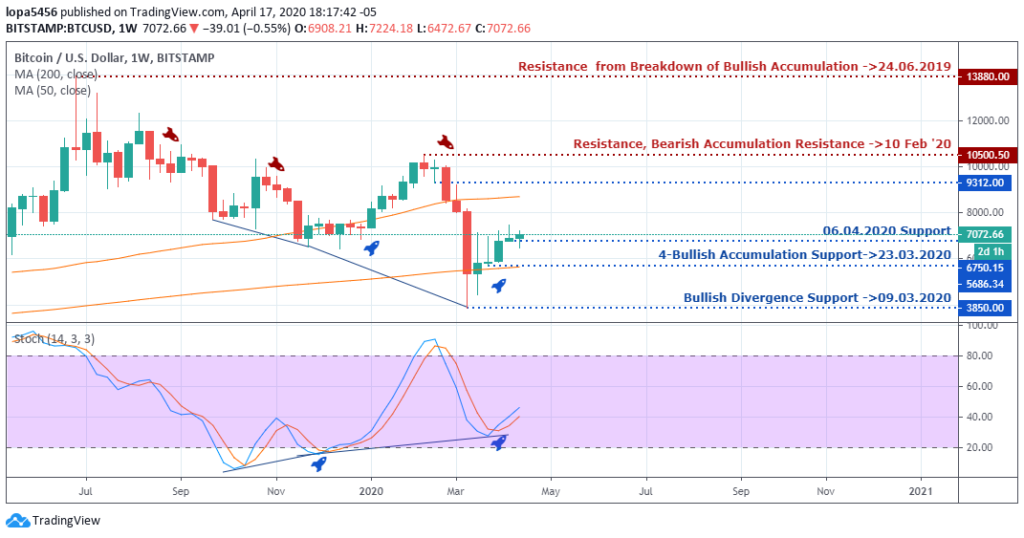
Weekly Chart

Resistance:
Over an extended period, the high of the resistance of bullish accumulation remains at $13880.00 since 24th of June 2019. Bitcoin price keeps making higher lows after a pullback.
The resistance established on the 10th of February 2020 pushes the price down from $10500.50 to $3850.00 after the bearish accumulation pattern.
Support:
The bitcoin found support on the 9th of February 2020, and the price started pulling back to the upside gradually.
The weekly time frame stochastic signals a bullish divergence move up. Price was rejected at $7072.66 twice before establishing a higher low (support) at $6750.15 on the 23rd of February 2020 and pushing higher.
You can see that if the bullish momentum should continue the key zone to washout for is between $9312.00 and $10500.50
Daily Chart
Resistance:
The breakdown of the Resistance level of BTCUSD (IFT) started from $10495.00, 12th February 2020.
After a long period of accumulations of order, the market makers were able to push the price of bitcoin down due to the fundamentals and market sentiments about coronavirus pandemic.
From the Stochastic oscillator, we can see that the price of bitcoin has been stretched in the overbought zone.
It had a little pullback after the initial push but still maintained its bearish bias and continued its bearish run ($8990.01 zone) to the downside and finding strong support at $3976.58.
Support:
The BTCUSD (IFT) Price of $3976.58 was confirmed as strong support after a bullish divergence was spotted on the indicator and price chart.
Furthermore, bitcoin price rallied up to$7124.44 before a retracement to $5869.00, established a higher low (support) with an engulfing candlestick pattern making the price to surge higher to $7469.00.
The bears are trapped selling from the breakdown of resistance on the 7th of April 2020.
Also, the indicator shows bullish hidden divergence, and the close of the daily candle indicates a bullish sentiment.
H4 Chart
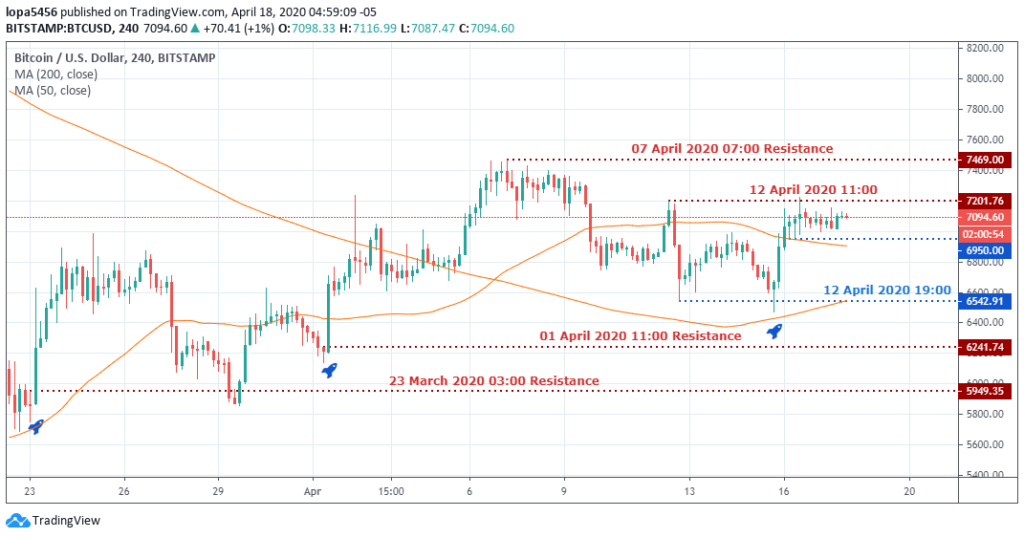
Resistance:
The Resistance price of bitcoin at $7469.00 held since 7th April 2020, creating the last swing High before the price drops lower. However, the movement of the price below $7094.60 led to the beginning of a downtrend.
On 12th April 2020, the bitcoin price retests the previous zone of $7094.60-$7201.76 to form a higher low (resistance) with a bearish engulfing candle pattern.
Support:
The rise of the uptrend started with continues rises of higher lows since 23rd March 2020 at the price level of $5949.35. The bullish engulfing candle pattern shows more buying pressure.
After the previous rise from the support zone of $5949.35, price found a support at $6241.74 with a strong bullish engulfing pattern on 1st April 2020 showing more buyers coming into the party. Price of bitcoin rose steadily from 1st April to 7th April 2020.
Bitcoin BTC Events and News
The Covid-19 has brought a lot of sentiments into the crypto market during the first quarter of the year, and many wonder what would happen to the world economy after seeing many lockdowns globally.
However, this 2nd quarter of the year you can see that it is showing some signs of relief in the market after the initial fear of the coronavirus has reduced due to a decline in previously rising new cases.
Price of Bitcoin Fighting to Close Week Beyond Key $7,200 Resistance Level
Price of Bitcoin closed the week near the $7,100 support after surging within a few dollars reach of $7,300.
Last week Saturday, the price of Bitcoin (BTC) went through the $7,200 resistance level all the way to $7,293. In the process, the price successfully escaped the resistance cluster that it has been trapped within since April 6, albeit briefly.
The price surge also resulted in altcoins adding commendable gains.
With that, the overall cryptocurrency market cap now stands at $208.4 billion, while the dominance rate of Bitcoin is 63.4%.
Bullish traders are now looking primarily on pushing the price above the $7,258 resistance in order to target $8,000.
Conclusion and Projection
The BTCUSD (LFT) shows that currently brokers are watching the market carefully paying attention to vital areas of the price for key decisions. If the price of bitcoin continues to gain momentum to the upside and closes above the resistance level of $7200 then there is a higher chance of price reaching the next resistance level of $8000-$8900.
The market has always had its two sides of its coin. As the price surges up, some market players are hoping to place a sell order at the resistance zone.
Above all the bitcoin market has its own mind to determine its next move.

No Comments found