Bitcoin to USD ( BTCUSD ) Weekly Outlook , August 29 2019
BTCUSD Forecast and Technical Analysis & Fundamentals for Bitcoin
Introduction
The department store Pricerite with fourteen locations in Hong Kong recently announced the acceptance of cryptocurrencies such as Bitcoin, Ether and Litecoin as an alternative payment medium in support of the ongoing protests.
The turmoil in Hong Kong resulted in an increase in Bitcoin trade volume as residents didn’t mind paying a premium ranging in hundreds on peer to peer Binomo.com platform, localbitcoins.
BTCUSD Technical Analysis
BTCUSD: Daily Chart

Resistance: $12145.42, $12325.00, $10955.48
Support: $9111.00, $9736.96, $9467.57, $9755.53, $9885.48
Coming one level lower to the daily mid-term chart, the bears on August 10, cut beneath bullish support $11450.93 delivering the price of the number one crypto down by about 15.8%.
Persistence of the bears was not sufficient enough to drive the Bitcoin price beyond the $9111.0 support, after descending from the July 31 price collapse. The event results in an unfolding hidden bullish divergence pattern on August 16, stressing a continuation of the bullish trend.
A breach of selling resistance over the weekend – August 23, signals bullish upbeat, on the other hand, if the Bitcoin price violates the $9467.57 support, we should expect an expansion of the BTC price towards the bearish direction.
BTCUSD: 4Hour Chart

Resistance: $10955.48, $10843.00, $10650.00
Support: $9467.57, $9880.00, $9755.53, $9885.48, $10019.10
The 4hour time frame presents excellent short term swing trading opportunities as the Bitcoin price on top Bitcoin broker platforms break significant resistance and support levels on August 15 ’19 15:00, August 20 ‘19 03:00, August 22 ’19 07:00, August 24 ’19 11:00, and August 26 ’19 19:00. This short term approach to trading better suits day traders, as they don’t have to hold positions for over twenty-four hours.
A new bear trap price pattern on August 27 ’19 07:00 sets support at $10019.10, as the Bitcoin price struggles to break above the hidden bearish resistance at $10158.97.
BTCUSD: 1Hour Chart
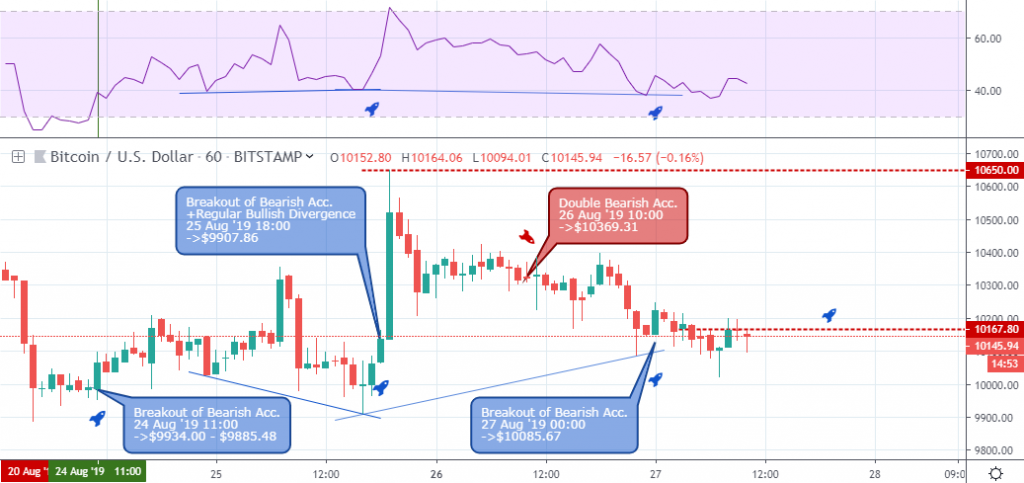
Resistance: $10650.00, 10369.31
Support: $9934.00, $9885.48, $9907.86, $10085.67
Formation of regular and hidden bullish divergence patterns in sequence bring hope to Bitcoin BTC HODLERs as the bulls claw their way through the dips of the recent parabolic motions.
Bitcoin Fundamentals
Data Shows that Price of Bitcoin ‘Not Atop’ of New Bull Cycle Yet
Analysis by Bitcoin Days Destroyed (BDD) technical metric has revealed that if crowd opinion takes control, the price of Bitcoin (BTC) can go far higher during the current market cycle.
Hans Hauge, a senior qualitative researcher of crypto investment fund Ikigai on August 22, made these revelations.
In a series of social media posts, Hans identified the current Bitcoin trend as being comparable to its early 2017 pattern. The pattern, as mentioned above, took place just months before the digital currency reached its all-time high of $20,000.
In a post on Twitter, Hauge revealed that Bitcoin bubble tops which are caused by public opinion and the conclusions and assumptions of the crowd are recognized with a dark red cluster of Adjusted Binary BDD.
BDD is the measure of time between movements of a certain amount of Bitcoin.
According to Hauge, higher prices appear to coincide with coins moving more frequently. However, the opposite sentiment is at present apparent.
Hauge also cautioned buyers buying the trough on the long-term to view the Bitcoin Fear & Greed Index. The index, which also evaluates the market trend, remains near the floor of its possible range.
Also, the BTC/USD pair has remained in a sideways pattern for a significant number of days this month, resulting in several commentators’ warning that a downturn is imminent.
According to a trader, a downward journey to the $7,000 range could be on the cards. He argues that such a pullback is historically likely and would not mean a bear run.
However, other market analysts foretell just the exact opposite.
Conclusion and Projection
The increase in buying pressure at publication time and the issues in Hong Kong show an increase in speculative adoption of Bitcoin BTC. We look forward to a price increase towards $10,955.48 by the weekend.

No Comments found