Bitcoin to USD ( BTCUSD ) Weekly Outlook , January 29 2019
BTCUSD Forecast and Technical Analysis & Fundamentals for Bitcoin
Introduction
Bitcoin BTC price set new highs as traders earnestly anticipate the third BTC halving set to take place in May ’20. An increase in miners’ revenue as illustrated on the MIREV chart below already shows a hike in Bitcoin price.
Read on for more insights into the technical and news events driving the BTCUSD on IQ Option platform.
Weekly Increase in Miners’ Revenue Prior to Third Halving

Notice an increase in miners’ revenue, which has been setting new highs for the past four weeks, and dragging the Bitcoin price along with it.
BTCUSD Technical Analysis
Monthly Chart
The bearish resistance level $7772.71 fails to stand the test of time as the Bitcoin price comfortably trades above it after the bullish retrace wave that lasts for about six months.
Here, we notice a pattern like the one that marked an end to the 2018 bearish trend. Traders and bitcoin enthusiasts on Bitcoin broker sites in anticipation of the Bitcoin BTC halving are already jumping in on the bullish campaign, with an expectation of new highs into the last half of Q1.
Weekly Chart

From a weekly chart point of view, the BTCUSD has so far maintained a healthy bullish trend as the bearish resistance levels give in to increasing buy power for about nine weeks now.
The bulls owe the price hike to a combination of bullish divergence and a breach of the $7495.00 resistance level.
Though the BTC price showed a slowing of the rise after the price touched the MA-200 last week, we begin to notice an increase in demand for Bitcoin BTC over the weekend.
Daily Chart
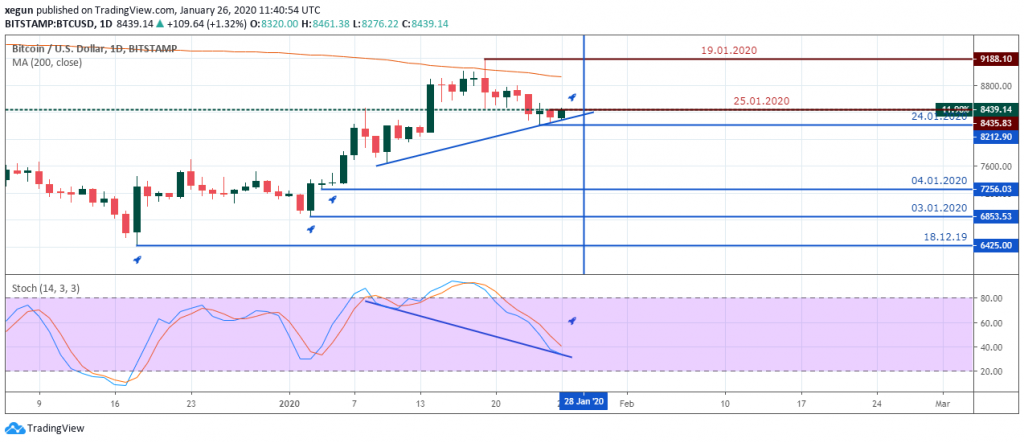
At the weekend, the BTCUSD on all exchanges including broker trading platforms, completes a corrective wave that came up as a result of the price hitting the MA-200. The price increase was signaled alongside a break of a hidden resistance level of $8435.83.
With this, we anticipate a breakout above the MA-200. On the contrary, if the Bitcoin price fails to close above the crucial MA-200 resistance by the end of this week, we should expect a deeper correction of the bullish trend.
4Hour Chart
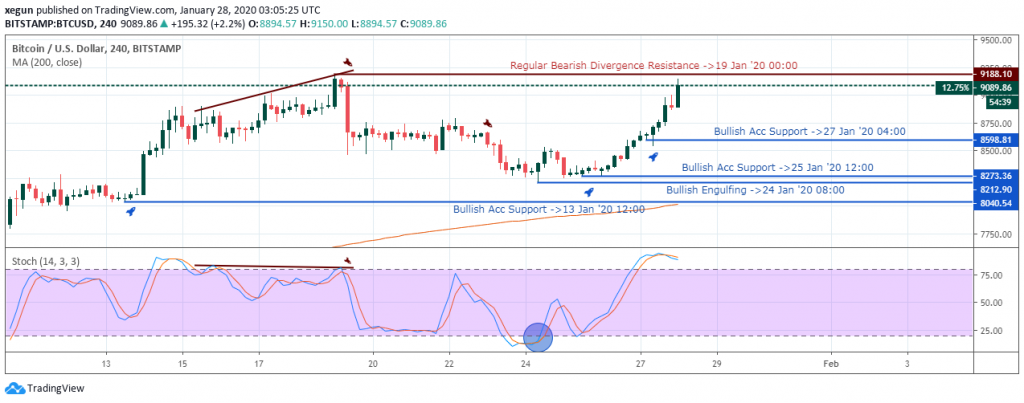
Finishing off on the H4 time frame, a sharp bullish thrust $86896.60 above the $8669.41 resistance may bring the bulls back into the game, and consequently, a breach of the 200-daily MA.
Conversely, a break below the $8461.38 support would indicate a prolonged bearish price correction phase.
Traders Target $9.2K as Price of Bitcoin Breaks through Key Resistance
Bitcoin (BTC) bull run continues to gather wind as witnessed in the price pushing above $9,000 to a daily high at $9,150.
Over the past week and on several days, the bull run had been gunning to hold the price above $8,800. Several attempts at knocking out the $9K mark were held back at $8,963 and $8,985.
Any level above the $9,200 mark will mean traders will begin to set their eyes on a level above $9,500.
The price of Bitcoin since January 24 has moved up by 11.31%. Any pullback in price could see Bitcoin fall back to $8,900.
Conclusion and Projection
Our top-down multiple time frame analysis in this post concludes that the bulls are in control of the market at press time, and we should see price setting new highs above crucial resistance zones by the end of the first quarter of 2020.

No Comments found