Bitcoin to USD ( BTCUSD ) Weekly Outlook , May 6 2020
BTCUSD Forecast and Technical Analysis & Fundamentals for Bitcoin
Introduction
The most exciting thing for the broker and other players this week is how the price of BTCUSD will move after finding itself in a ranging zone in the monthly time frame. The coronavirus pandemic is still a concern to the worlds’ economy because of its effects and loss of businesses.
BTCUSD Technical Analysis
Monthly Chart

Monthly Resistance Levels:
19666.00, 1163.00, 725.00
Monthly Support Levels:
2.22, 15.00, 81.50, 152.40, 262.98, 4265.00, 5920.72
The BTCUSD trend has been bullish since 2011; however, the momentum is weak since the price pushed back from the resistance point of 19666.00, on a railroad track (candlestick pattern) on 01-12-2017. A failure swing may occur if the bears can take out the support of 5920.72 which will expose the previous level of resistance zone (1163.00).
Weekly Chart

Weekly Resistance Levels:
13380.00, 10955.48, 9320.00
Weekly Support Levels:
3322.19, 3536.77, 3850.00, 4912.00, 5466.06
For the past three weeks, the brokers have been able to take the price of BTCUSD higher and approaching a resistance zone of 10955.
As the weekends, we shall wait to see if the buyers can take the price above the resistance, or we shall see the bears taking over and reverse.
Daily Chart
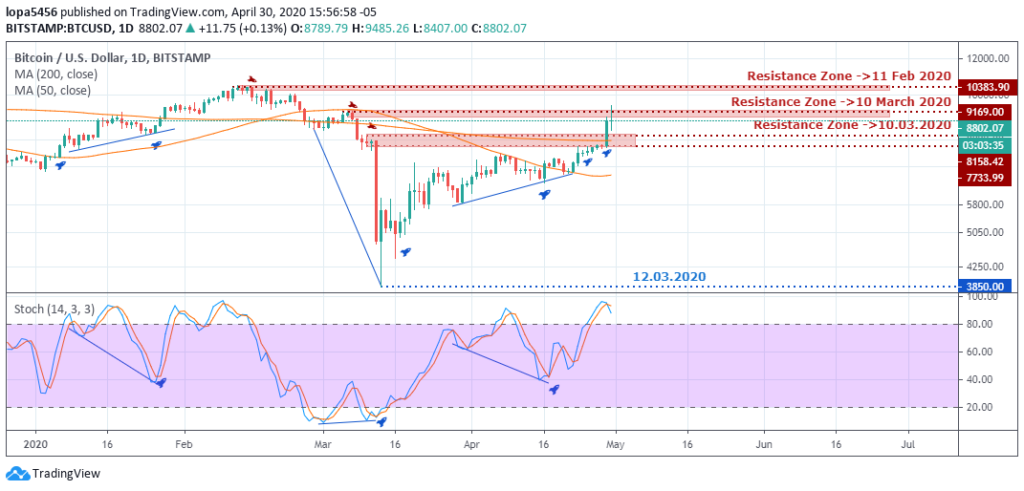
Daily Resistance Levels:
10383.90, 9169.00, 8802.07,
Daily Support Levels:
3850.00, 8158.42
The bulls struggled to close above (9169.00) the March 10th 2020 resistance zone after a strong bullish momentum from the 8158.42.
If the bulls can close above significant zones, we can see the trend rise higher.
However, the stochastic shows price at the overbought zone after a previous rise. This implies that we may see a correction soon. It is not 100% certain because the price still has a higher possibility to keep going up.
H4 Chart
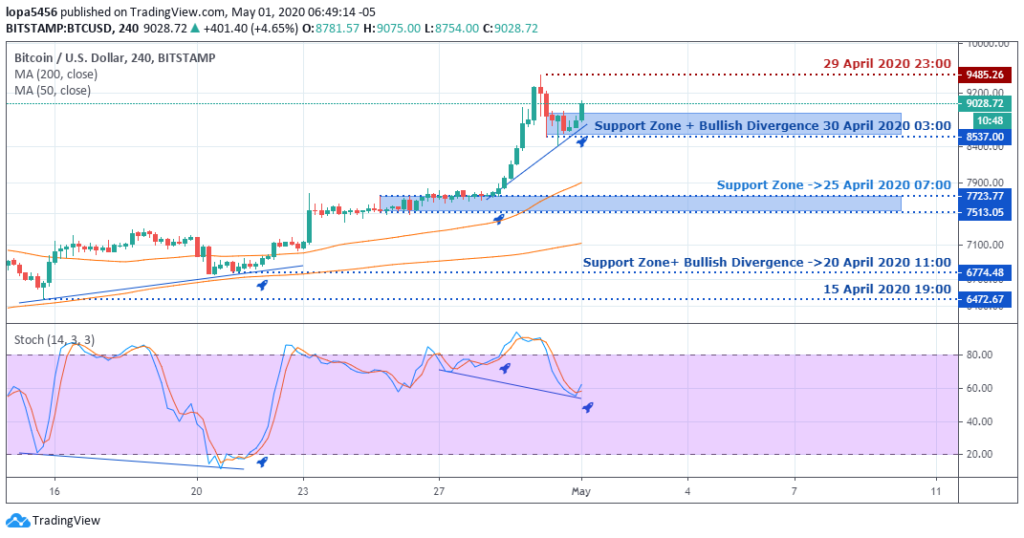
H4 Resistance Levels:
9485.26
H4 Support Levels:
6472.67, 6774.48, 7513.05, 7723.77, 8537.00
The BTCUSD has been enjoying a bullish run for some days when it found support on April 25th, 2020 (7723.77). The buyers’ momentum seen on the stochastic with a bullish divergence playing out on the support zone of 8537.00.
Bullish Scenario:
Generally, the market is in a bulls’ trend, and the momentum to go up is obvious. The question to ask now is, how long can the bulls sustain their run?
Bearish Scenario:
There are chances that some key players are waiting for BTCUSD to get to a specific resistance zone before placing orders to establish a downtrend bias.
Bitcoin BTC News Events
The Bitcoin is becoming a haven for brokers, investors, institutions, and retail traders after COVID-19 declared war on a global economy. The effect of the coronavirus pandemic has led to a sharp fall in the fiat market, stocks, and government bonds.
Investors in bitcoin are looking forward to the upcoming block reward halving in a few weeks.
Conclusion and Projection
The bitcoin is gaining strength in the market after the coronavirus pandemic that ravished the global economy. The means to bring this pandemic to a halt is on the rise, as they have developed vaccines in different continents to save lives and for healthy living.
As the price of bitcoin approaches the resistance level, we will look out for its reaction around that zone because another decision is made on the weekly time frame.
Having tested the MA-50 and closed bullish in April from a monthly chart horizon, we expect a bullish rally as we enter the second half of Q2 2020.

No Comments found