Bitcoin to USD ( BTCUSD ) Forecast & Weekly Analysis, November 29 2018
Bitcoin to USD – Technical Analysis & Weekly Forecast
Introduction
Welcome to a new week, as we take a look at the weekly outlook of the Bitcoin to USD pair. Last week we made a projection of price attaining our second profit target of $4017.14, and prior to the week’s close, price crashes through our second profit target, eventually making us a whopping 37.34% profit compared to a 15.01% risk.
Fundamentals
This week, we’ll do a quick recap of the fundamental events that led to last week’s price crash. From there, we’ll move on to look at upcoming events that could lead to a probable reversal or further plummet!
Review of Past and Upcoming Events in the Bitcoin Community
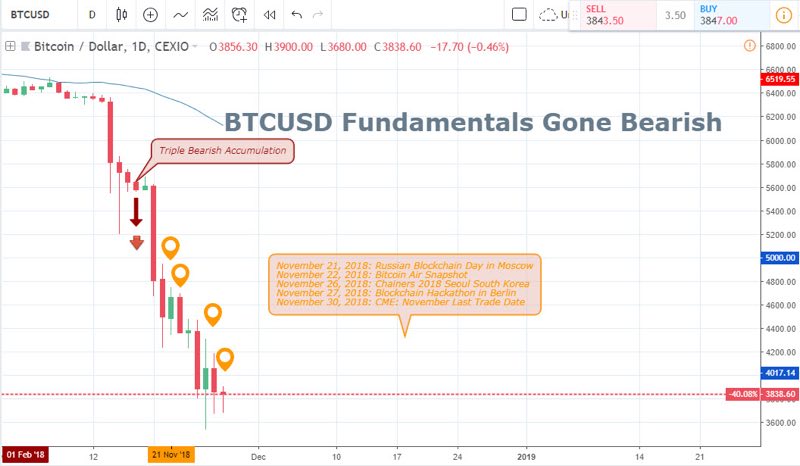
The above price chart highlights the technical triple bearish accumulation price action patterns that initiated triple short selling points from 15, 16 and November 17.
November 21, 2018: Russian Blockchain Day in Moscow
Making reference to the above daily chart, a bullish inside bar was triggered at the closing price of the Russian blockchain day event. The pattern indicated an attempt for the bulls to recover their position, which is more of an unclear and insufficient pattern for an upward move.
November 22, 2018: Bitcoin Air Snapshot
You will agree with me here that speculators interpreted the Bitcoin airdrop as a way to get new money into space, as a way of creating awareness for the digital currency giant. The market knows better, as speculators immediately entered short positions, consequently leading to a bearish closing day.
November 26, 2018: Chainers 2018 Seoul South Korea
A bearish closing day of the last event served as fuel for the bears to resume the downtrend. Similarly, the Chainers conference held in Seoul South Korea couldn’t serve as a catalyst for a bullish recovery as the market was already in a bearish sentiment.
Upcoming Events
November 27, 2018: Blockchain Hackathon in Berlin
The blockchain hackathon takes place today on the 27th of November. The daily chart does not show much clarity on how this event affects the Bitcoin price; hence we make reference to the 4hr and 2hr technical charts below.
November 30, 2018: CME Last Trade date
The CME last trade date has been a significant date looked out for by most cryptocurrency speculators and bitcoin exchanges as it has been known to be a reference point for a continuation or change in the exchange rate of the Bitcoin to USD. If this new week closes, signalling a bearish accumulation pattern, a continuation of the bearish trend with low-risk exposure can be attempted. However, a price close above the bearish accumulation resistance will signal breakout of bearish accumulation; hence a change in trend from bearish to bullish.
Technical Analysis
4-HR Chart of the BTC/USD
We take to the 4-hour chart for a closer technical outlook of the week. From the above chart, price entered into a consecutive bearish hidden divergence pattern. A cyclic oscillatory pattern indicating a continuation of the bearish trend. First was a breakdown of a bullish accumulation pattern on 22nd of November, followed by a combination of bullish breakdown, bearish accumulation and bearish hidden divergence patterns on the November 24. Prior to publishing this post, another confluence of events just got fired in the form of another breakdown of bullish accumulation and bearish hidden divergence.
2-HR Chart of the BTC/USD Pair
A bearish hidden divergence with similar data points as the 4hour chart is triggered on the 2hour chart above. This price pattern is formed in combination with two bearish accumulation patterns.
The breakdown of bullish accumulation pattern is worth considering for a short-term sell trade with trade exit at a price close above the $3982.12 resistance level. Profit taking exit point can be of a 2.0 risk/reward ratio.
Conclusion and Projection
The weekly chart below shows price hitting both established take profit targets. Overall, the short sell trade entered attained a 43.46% maximum favourable excursion at the point of writing this article, compared to a 2.38% risk.
Weekly Chart of the BTC/USD Pair

If you look closer at the above weekly chart, you’ll notice that the MACD oscillator previously growing and approaching the zero level hs finally established a dead cross. This signals further drop in Bitcoin price. However, we are using this point as a profit taking point, and will only enter another short trade at the formation of another signal.
Update to 4-hour Chart of the BTC/USD
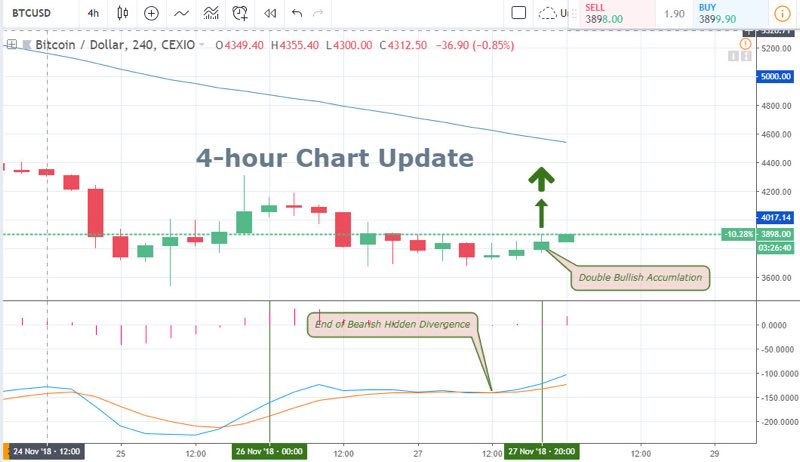
Here we do a quick update to the 4-hour chart analysis. Just before making this post we noticed a double bullish accumulation pattern and a golden cross of the MACD oscillator both indicating the beginning of a short term bullish trend.
Top 3 Bitcoin Brokers to trade Bitcoin to USD


No Comments found