Bitcoin to USD ( BTCUSD ) Forecast & Weekly Analysis, November 17 201
BTC to USD Weekly Forecast & Technical Analysis
Introduction
In the previous weeks, we’ve had a bearish bias towards the price of the BTC/USD, following the technical price action and fundamental announcements in the Bitcoin/digital currency space. Read on for an overview of events as they unfold and our forecast into the coming weeks.
Fundamentals
The chart below will guide us from a daily time horizon, the price dynamics of the fundamental events for the BTC.
Review of Past and Upcoming Events in the Bitcoin Community
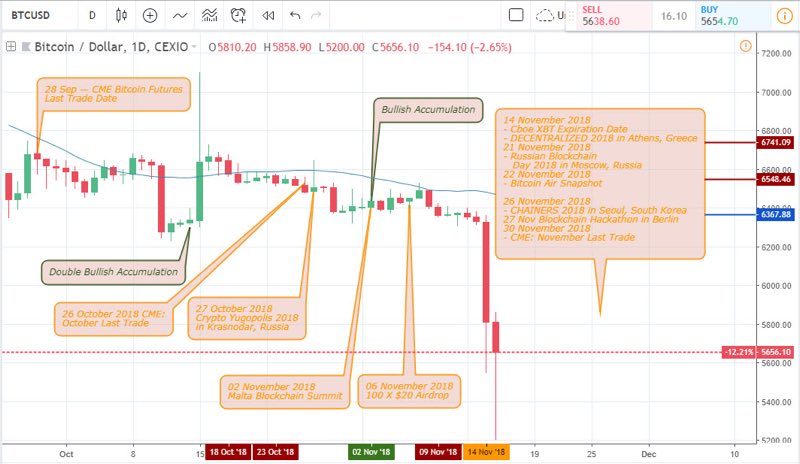
26 October 2018 CME: October Last Trade
The last trade date of the CME has proven to be an important reference point for determining the trend direction the BTCUSD. Prior to the date, we’ll notice a double bullish accumulation pattern that ‘s trapped below the 65-period moving average resistance.
At the closing price of the CME last trade date, price eventually broke below the bullish accumulation pattern forming a resistance level at 6548.46.
27 October 2018 Crypto Yugopolis 2018 in Krasnodar, Russia
The next day after the CME last trade date was the Krasnodar-Russia Yugopolis conference, which caused the price of the Bitcoin to USD to whip-saw, creating a huge upward spike. This did not result in a breakout of the resistance level as the day closed as an inverted hammer, leading to a continuation of the bearish trend line.
Upcoming Events
14 November 2018 – Cboe XBT Expiration Date and
DECENTRALIZED 2018 in Athens, Greece
From our last article, we mentioned that the technical outlook will serve as housekeeping when determining the direction of the Cboe XBT Expiration date. Well, the date came and a failure of bullish accumulation pattern was detected on one of the exchanges, Coinbase to be specific. From the chart below, price broke the bullish accumulation support and plummet by about 16.66% compared to a 2.22% risk.

Following this price drop, other upcoming events are as follows:
– November 21, 2018: Russian Blockchain Day in Moscow
– November 22, 2018: Bitcoin Air Snapshot
– November 26, 2018: CHAINERS 2018, in Seoul, South Korea
– November 27, 2018: Blockchain Hackathon in Berlin
– November 30, 2018: CME Last Trade date.
Just like the Cboe XBT expiration date, we’ll consider the technical price action signals for timing market trade entry.
Conclusion and Projection
Here will be considering the monthly and weekly chart for our projected price targets and the risks involved while shorting the BTC/USD pair.
Monthly Chart of the BTC/USD Pair

Still following a bearish decline we projected in our previous article, you’ll agree with me that this month is already moving in that direction following the signals of a bearish accumulation pattern. As the decline progresses, we expect the move to continue towards the 4013.00 (36.86%) profit target.
Weekly Chart of the BTC/USD
From the weekly chart, you will notice a bearish accumulation pattern triggered on October,1. It took another six weeks for the price to make a bearish decline of about 19.70% compared to a 4.58% risk.
2-HR Chart of the BTC/USD Pair
More recently, the 2-hour chart highlights the bullish accumulation pattern formed which leads to temporary profit taking points for the short sell trades.
Moving forward, we expect to short-sell more breakdown of bullish accumulation patterns, as the monthly charts bearish accumulation trigger is still at play.
Top 3 Bitcoin Brokers to trade BTC to USD


No Comments found