BTCUSD Weekly Outlook , December 26 2018
Cryptocurrency – Technical Analysis & Weekly Forecast
Introduction
The bullish trend of 2017 drew in a lot of newbies into the world of cryptocurrency trading with hopes of profiting from a rising market. Some even said the trend would last forever. With little or no understanding of how time series charts work, they plunged head first into the unknown trading their dollars for private keys with no idea of when cash in on their gains. The year 2018 is coming to a close and we see a
BTCUSD: Weekly Chart

A bullish engulfing pattern, also known as a false break pattern is triggered on the weekly time frame, signaling a retracement of the bearish trend. Further bullish price action patterns may confirm a switch in trend direction from bearish to bullish.
Fundamentals
About 340 UK Cryptocurrency Companies Stopped Operations in 2018
According to reports from Sky News a British news outlet on 22nd December, about 340 cryptocurrency or blockchain businesses were terminated in the United Kingdom (UK) this year. This data was gathered by OpenCorporates, the U.K.’s registrar of companies. Furthermore, 60% of the businesses dissolved this year ceased to function between the months of June and November.
The numbers have more than doubled this year compared to the 139 liquidated companies in 2017. Newly listed cryptocurrency companies were slowly rising than the number of terminated companies this year.
Major players in the space such as Bitmain, the Chinese crypto mining giant and Consensys have recently laid off their staff.
Regardless of the market showing a huge bearish sentiment, blockchain developers are in high demand on LinkedIn, making it one of the fastest emerging jobs in the U.S.
Daily Chart of the BTCUSD
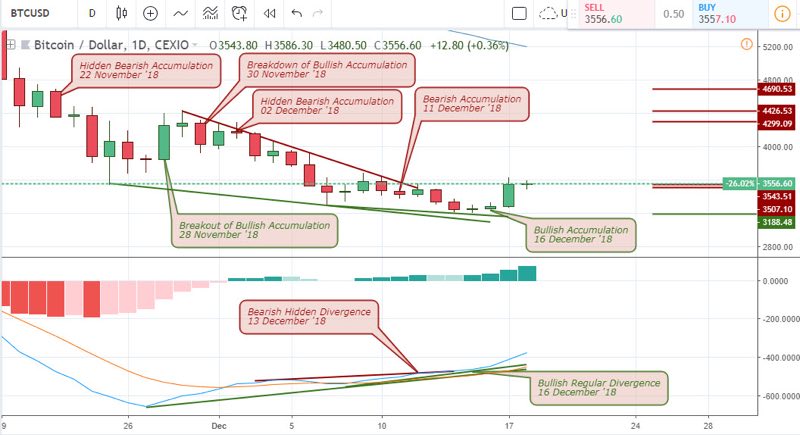
As the year slowly comes to a close, the Bitcoin price enters into a bearish regular divergence formation indicating a probable retracement of the bearish trend. This pattern was confirmed by a bullish accumualtion pattern, leading to a 30.0% growth from the 3200.00 low.
At the point of putting this article together, the pair triggers a hidden bearish accumulation pattern on 23rd December, signalling a continuation of the bearish trend.
Upcoming Events
December 28 2018 – CME: December Last Trade
The Bitcoin CME last trade date in combination with a technical price pattern formation within the time range is an event that could likely give clarity to the trend direction of 2019. Some bitcoin broker platforms offering bitcoin related news events may announce these event and others. You may want to visit the broker section of our website for a list of bitcoin broker platforms for trusted and reliable trade execution as well as a great user experience.
BTC/USD: 4-HR Chart
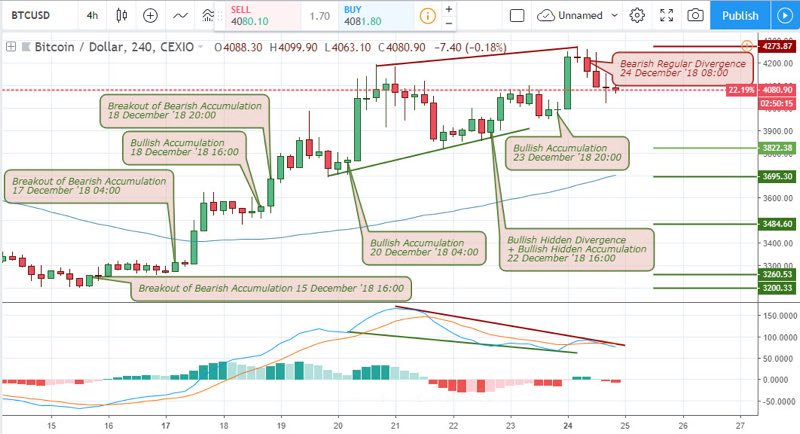
The above 4hr chart triggers a bearish regular divergence after the bitcoin price rose by 30.0% from a 3255.70 breakout price level. The price closely trades above the MA65 and only time will tell if it won’t close below it.
Conclusion and Projection
The current descent of the cryptocurrency market in 2018 has had a negative impact on some of the largest businesses. As a result, there is currently no sign of a bullish price recovery on the most significant time frame, the monthly chart. On the other hand, the weekly time frame triggers a bullish engulfing pattern which may be the beginning of a bullish trend in 2019.
Top 3 Cryptocurrency Brokers to trade BTCUSD


No Comments found