Bitcoin to USD ( BTCUSD ) Weekly Outlook , January 10 2018
Technical Analysis & Weekly Forecast for Bitcoin Brokers
Introduction
If you are new to trading, you’ll quickly come to realize that it’s a zero-sum game. What this implies is that your win is someone else’s loss.
With that in mind, last year’s bearish winter was not a total disaster for everyone in the cryptocurrency market. All that money didn’t just vanish into space. Someone or organization, went home smiling to the bank, while the dumb money held on too tight to their private keys. Join us as we look at the fundamental and technical event driving the Bitcoin price.
BTCUSD: Monthly Chart

Major Bitcoin broker platforms triggered a double bearish accumulation pattern on October ’18, indicating an increase in selling pressure.
The closing price of last year December established a strong resistance level at 4290.00. Although this is not a strong enough sell pressure, a confirmation from the lower time frame in the form of a breakdown of bullish accumulation should confirm selling presence.
BTCUSD: Weekly Chart
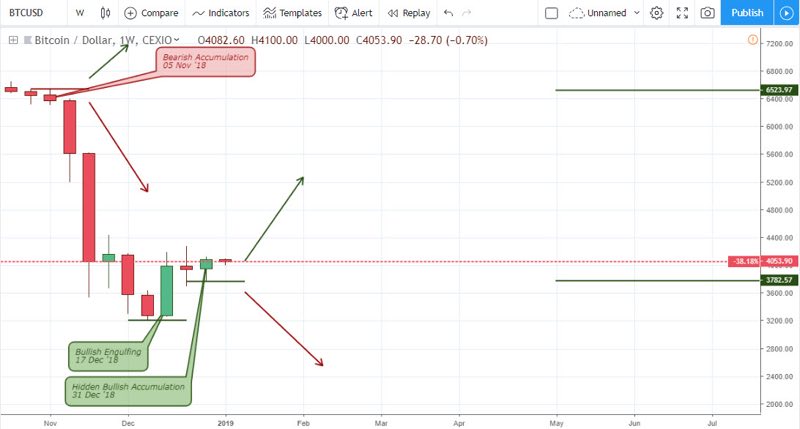
Looking at the pair from a weekly chart perspective, we’ll observe a slowing of the bearish trend and clues of a bullish campaign. A hidden bullish accumulation on December 31 ’18, shows the presence of bulls in the market.
In the News: Bitcoin ATM Producer Relocates to Switzerland Due to Regulatory Demand
Lamassu Industries AG a Bitcoin ATM manufacturer has relocated to Switzerland where rules governing cryptocurrencies are clearly defined. The ATM manufacturing company which claims to not have any holdings in bitcoin or participate in the exchange of cryptocurrency had their application to open an account rejected by 15 banks.
This leads to relocation of most cryptocurrency based companies to countries like
Switzerland, Malta, Estonia, Bermuda, and Liechtenstein popular for their crypto friendly approach.
Upcoming Events
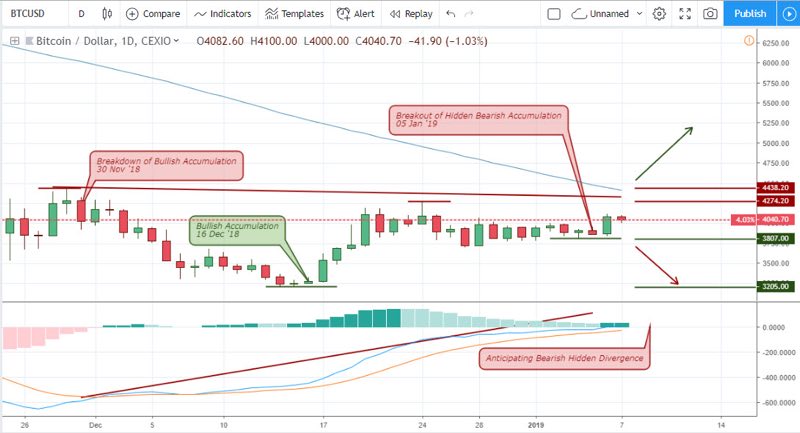
The daily chart of the BTCUSD shows how the pair recovers from a bearish trend by the bullish accumulation on 16 December ‘18. A closing price above the 4438.20 resistance level will end the possibility of bearish divergence.
Bitcoin (BTC) Cboe XBT Expiration Date 16 January 2019
The XBT expiration is an important event that has likely hood of pushing the Bitcoin price higher or lower. A rise in volatility is expected on that day.
Bitcoin (BTC) Crypto Finance Conference16 January 2019
The world’s date of the most exclusive cryptocurrency and investor conference is here. This event will be taking place at St. Moritz Switzerland between 16 and 18 January.
BTC/USD: 2-HR Chart
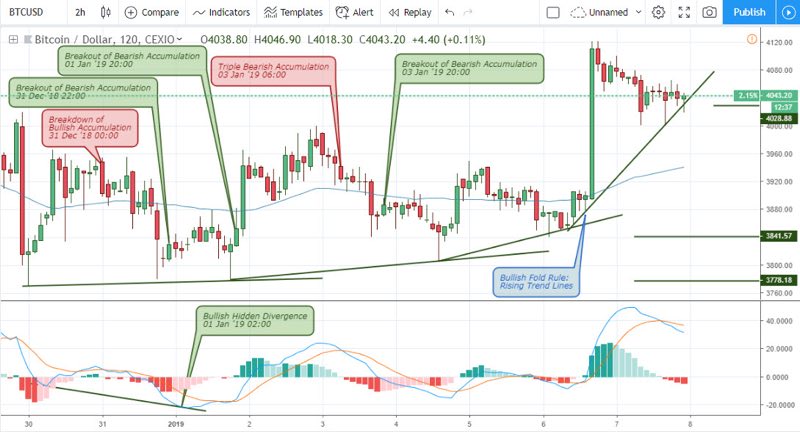
The 2hour chart is most suitable for scalp trading on major Bitcoin brokers. After a series of alternating breakout and breakdown of bearish and bullish accumulation patterns, the pair form this time horizon enters a Fold-Rule formation. THe fold-rule involves an increase in angle of inclination of the trend lines, living critical support levels at 4028.88, 3841.57, and 3778.18.
Conclusion and Projection
The current rise in the volatility of the pair in our opinion shows the activity of scalpers in the market. We hold high the monthly charts resistance level at 4290.00, and only at a price close above this level from a monthly chart alone, do we consider a possible change in trend to the upside and probably a bullish 2019.

No Comments found