Bitcoin to USD ( BTCUSD ) Weekly Outlook , June 20 2019
BTCUSD Forecast and Technical Analysis & Fundamentals for Bitcoin
Introduction
As mainstream adoption of cryptocurrencies continues to increase, traditional MetaTrader 4 forex broker platforms now offer the trading of crypto assets. Among such are FoxPro, Liteforex, Binomo, and OANDA. This and an increase in institutional adoption of Bitcoin, alongside newly formed all-time highs of BTC CME open interest, reinforce the demand for Bitcoin.
Following a top-down price analysis, let’s analyze the price dynamics of the BTCUSD.
BTCUSD Technical Analysis
BTC/USD Weekly

Here on the above weekly time frame, the BTCUSD came out of the overbought area on 03 June ‘19, signaling a bear trap candlestick pattern, as the pair broke below the 8005.0 USD support.
On the following week 10 June ’19, the bulls signaled bullish momentum and forced the Bitcoin price back above the level-70, and currently threaten to close above the 9109.0 USD resistance.
A bullish closing week above the 9109.0 USD will confirm a continuation of the bullish price rally.
Now, let’s take one step and head to see the patterned buildup on the daily time frame.
BTCUSD: Daily Chart

Generally, on all bitcoin broker platforms, the daily chart view shows the BTC price enclosed within an expanding channel formed from bearish and bullish divergence setups of the Relative Strength Index, with the recent one being a hidden bullish divergence. Buying pressure pattern was signaled at the point of forming the divergence with support established at 7455.0, as the Bitcoin price continued an upbeat campaign.
At press time the BTC hovers above the 9000.0 USD level with current weekly high at 9490.0 USD.
BTCUSD: 4Hour Chart

The Bitcoin price skyrocket by roughly 14.7% after breaking out of bearish resistance and entering overbought territory on 14 June 07:00.
Notice how demand for the BTC decreased after a regular bearish divergence on 17 June 23:00. The bulls still showed resilience to take the price higher by firing a hidden bullish divergence pattern on 18 June 19:00, and setting support at 8945.0 USD. This upbeat campaign continued into 19 June 15:00 where bearish resistance again failed to further increase in buying pressure.
BTCUSD: 1Hour Chart
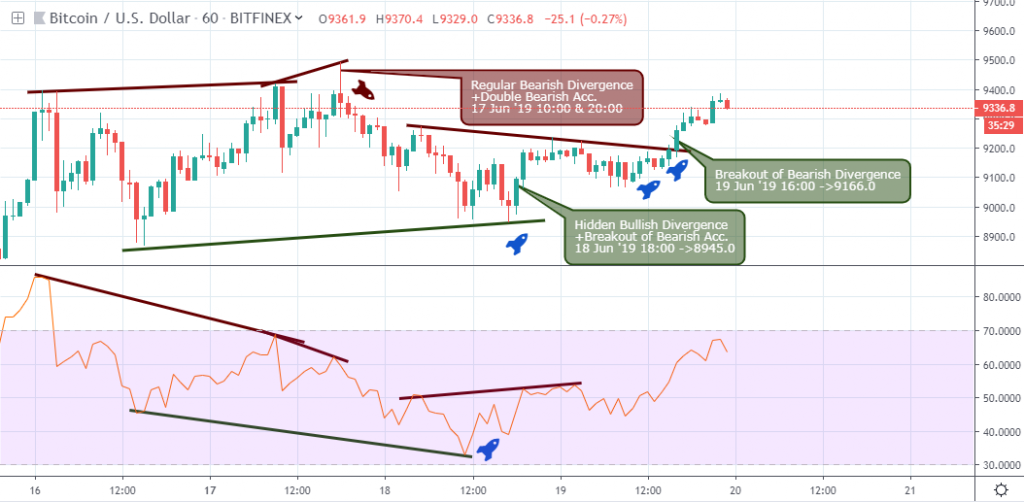
Let’s wrap up with the 1hour time frame as it also signaled selling pressure following regular bearish divergence on 10th and 20th hour of 17 June 10:00.
After a price decline from the bearish divergence, the 1hour intraday chart triggered a breakout of bearish accumulation in combination with hidden bullish divergence on 18 June 18:00.
An attempt by the bears to bring the price south again failed to increase in demand for the BTC, as price broke above the bearish trend line resistance on 19 June 16:00, with support set at 9166.0.
Bitcoin Fundamentals
Authorities in Brazil requires User Transaction Reports from Crypto Exchanges.
In a bid to arrest tax evasion, and fraud, Brazil Department of Federal Revenue issued new guidelines on crypto exchanges, demanding for user information, in compliance with the Normative Instruction 1.88/2019.
All crypto Exchanges based in Brazil are all required to provide all transaction details on their system, while external platforms must provide information when the value of monthly operations exceeds 30K Brazilian Real, about 7750.00 USD.
Conclusion and Projection
In the long term, the bitcoin price is projected to shoot beyond the 10,000.00 USD round number, as the price approach the overbought area from the 4hour chart point of view, signaling an increase in buying power.

No Comments found