USD/INR – Weekly Outlook ( June 1, 2018 )
Weekly Forex Forecast for India Brokers
Introduction
Last week we reviewed inflation in India and how it affects the price of Indian Rupees traded against the U.S. dollar. We also did the usual housekeeping with technical analysis, projecting a bullish direction for the pair. Overall, our projection was accurate with new highs being established. Fundamentals analyzed last week had more to do with inflation and unemployment rate.
This week we’ll be taking a look at the GDP and interest rates in India, along with recent technical analysis. We’ll even zoom in a little closer into the 2hrs chart from a technical point of view.
United States & India’s Interest Rate Overview
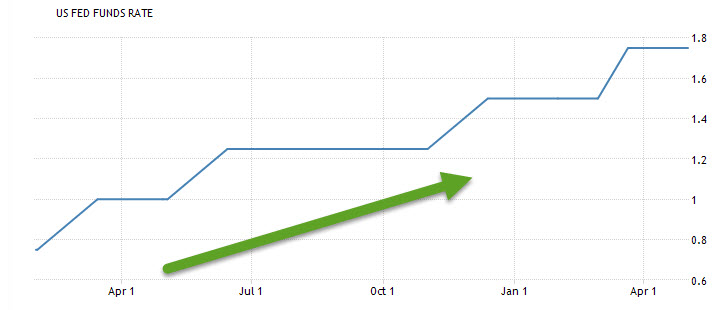
Last month 5th of April, India’s central bank (Reserve Bank of India) sustained its interest rate at 6% which equates to market expectations. On the other hand, the United States Interest rate keeps a steady rise in value, which we believe to cause the pair USDINR stay above the 65-period moving average with a price close on 11-05-2018.
Price finally closed below the 65 periods Moving average on 25th May 2018 indicating a recovery of the Indian Rupees causing a decline in the exchange rate of USD to INR. This implies a strengthening of the Indian Rupees. The slow but steady interest rate in India plus a rising inflation may have prompt speculators to predict government intervention hence India Forex traders/speculators alike may have bet against this move.
Real Gross Domestic Product in India
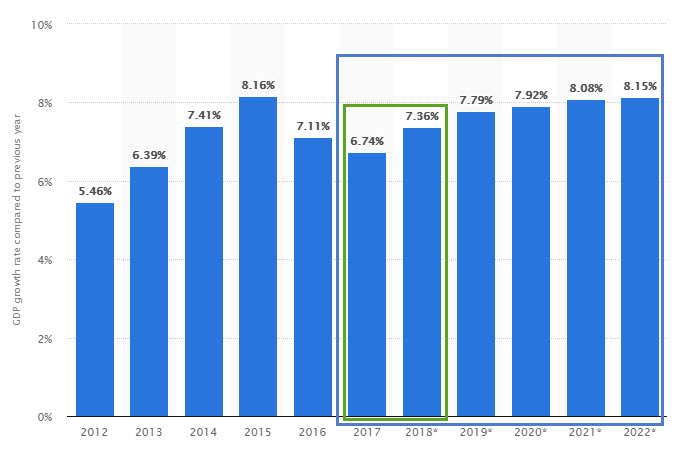
A rising Gross domestic product in India is also analyzed to account for the current strengthening of the Indian Rupees. In the current year 2018 as shown in the chart below, there is a percentage rise in real GDP.
Technical Analysis
2-Hour (120mins) Time Frame
As promised we’ll be zooming closer to the 2hr charts. The pair established selling pressure at 67.888 on 29-05-2018, and trading below its 65 periods moving average.

4-Hour (H4) Time Frame
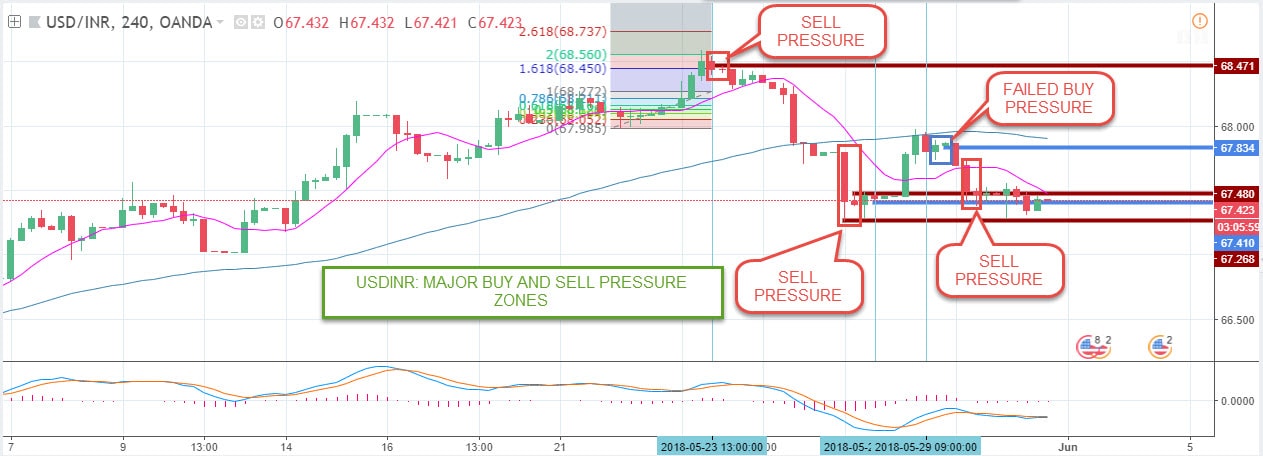
Last week was filled with optimism for the pair USDINR as it traded above the 65-period moving average. The pair closed below the moving average on the 28th of this week and continued to trade lower.
This move started after the pair was trapped below the 2.618 Fibonacci (68.7377 INR) resistance level, followed by sell pressure on 23rd.
As shown on the chart, the pair closed bearish and established another sell pressure which failed to hold its ground on 28-05-2018. Price retraced back to the 65-period moving average which later served as a resistance level. This was also followed by a buying pressure which later failed on the 30th 05 2018. Moving forward, another sell pressure was formed which we believe will push the exchange rate of USD to INR lower.
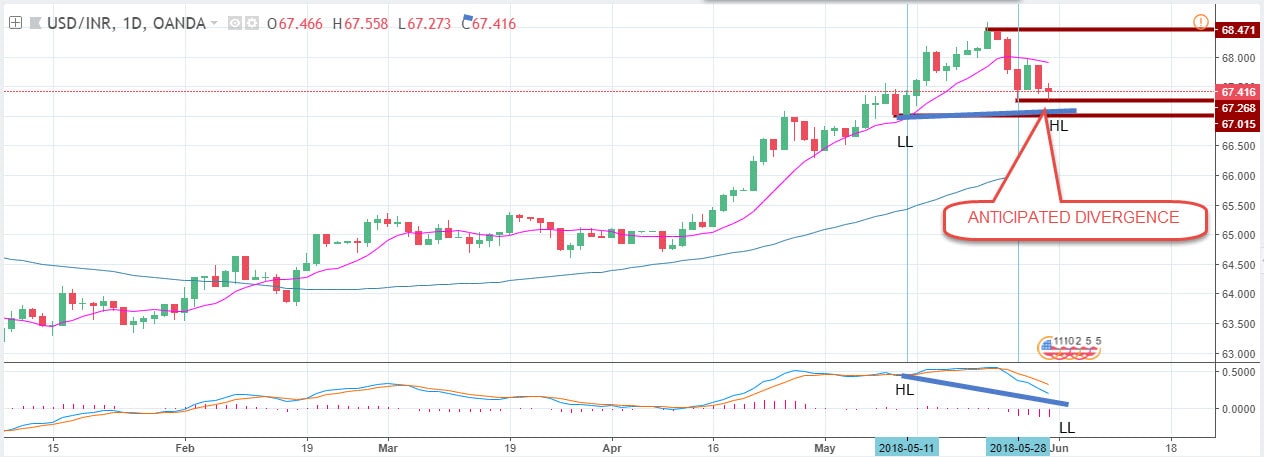
USDINR Daily Chart: Anticipated Bullish Divergence
Hidden bearish divergence though not yet formed is anticipated on the weekly timeframe. The MACD (9, 21, and 5) is establishing lower lows, as the corresponding price has not violated the 67.015 level established on 11-05-2018.
Projection and Conclusion
At the moment, we expect the current intermediate bearish trend to continue, and a failure of the 67.015 price level to extend towards 66.29 price level.
Finally, as a resident of India, you can check the following India Forex brokers and subscribe for a trading account. Most of them offer demo/practice accounts which are risk-free trading alternatives.
Top 3 India Forex Brokers to trade USD/INR


No Comments found