USD/INR – Weekly Outlook for May 10 2019
USD/INR Forecast & Technical Analysis for Indian Rupee
Introduction
The long-expected failure of the Nifty 50 was finally signalled as the daily chart flagged a series of bearish divergence on 03, and 22 April, followed by double bearish accumulation setups on 03 May ’19.
Come along as we look into other interesting news announcement and technical price patterns driving the price of the Indian Rupee.
India’s Fundamentals
India Cumulative Industrial Output
India’s Ministry of Statistics and Programme Implementation will be releasing the Cumulative Industrial Output on Friday, May 10 ’19. This calculates the weighted average of Indian factory outputs.
Readings on the high side are viewed as bullish for the Indian Rupee, while lower values are considered bearish.
United States Fundamentals
Speech: Fed’s Chair Powell
The United States president Donald Trump nominated Jerome H. Powell Chairman of the Federal Reserve on 2nd November ’17. He assumed office on 5th February ’18.
Traders and speculators will be looking out for a hawkish or dovish undertone of his speech as this may hint on future actions to be taken on the USD.
Technical Analysis
USD/INR: Weekly Chart
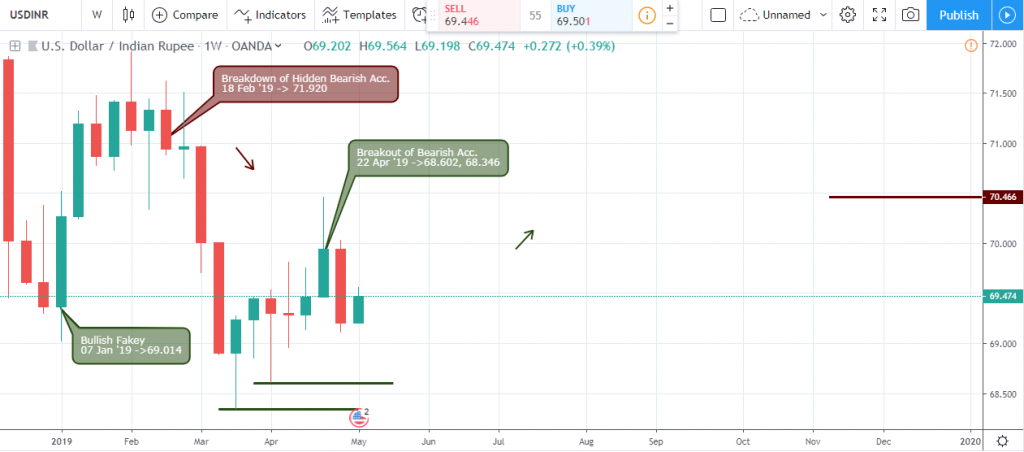
The above weekly chart started with an upward swing triggered by a bullish Fakey pattern on 07 January ’19. About 6 weeks after the initial price surge, the bears replied with an increase in selling pressure on 18 February ’19.
A breakout of selling pressure on 22 April ’19 countered the attempts of sellers forcing the exchange rate of USD to INR above the 69.812 resistance level. This recent price break sets strong support levels at 68.602 and 68.346 respectively.
USDINR Daily Chart
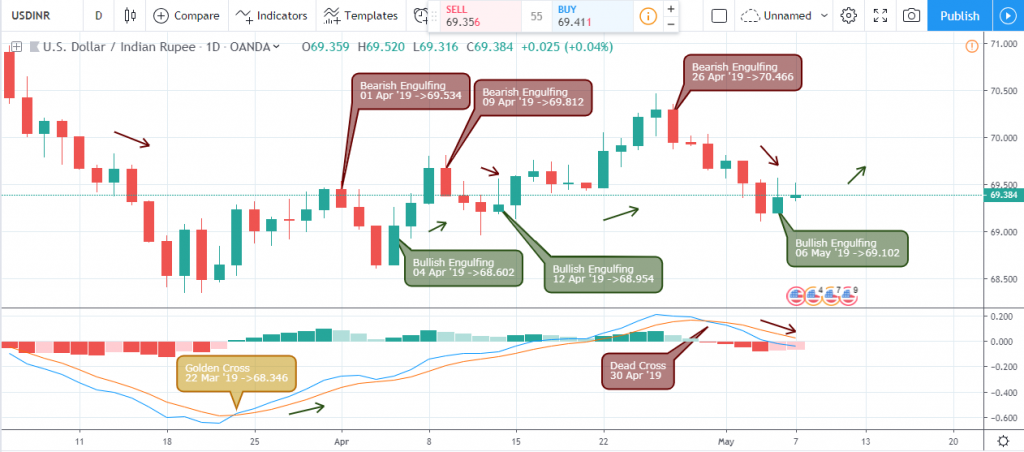
Let’s take it one step down to the daily chart, where the golden cross of MACD initialized a slow but steady upward trend.
The peaks and valleys of the rising trend are built up of breakdown and breakout of bearish and bullish accumulation setups on 01, 04, 09, 12, and 26 April ’19.
A bullish engulfing pattern was finally signaled on 07 May ’19 with strong support at 69.102 with possibilities of sending the trend back in the upward direction.
USDINR 4HR Chart
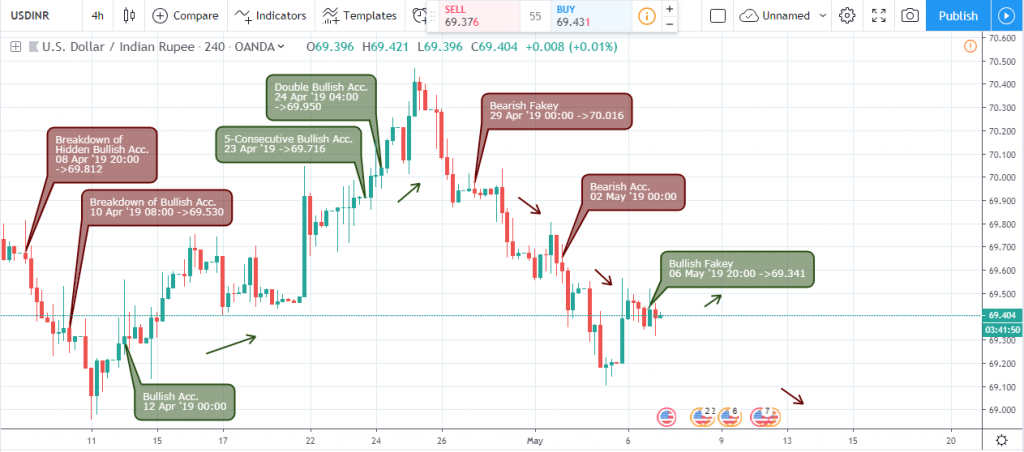
Further down to the 4hour time frame, the USD/INR broke below hidden bullish pressure support on 08 April ’19 20:00, as the price declined by 0.97% and setting up resistance at 69.812.
Single bullish accumulation support signaled on 12 April ’19 00:00 is sufficient for a price increase of 1.60%. The bearish Fakey setup flagged on 29 April ’19 00:00 forced the pair into a downward spiral.
A more recent bullish Fakey pattern on 06 May ’19 20:00 sets the pair up for a bullish rally.
USDINR 2HR Chart
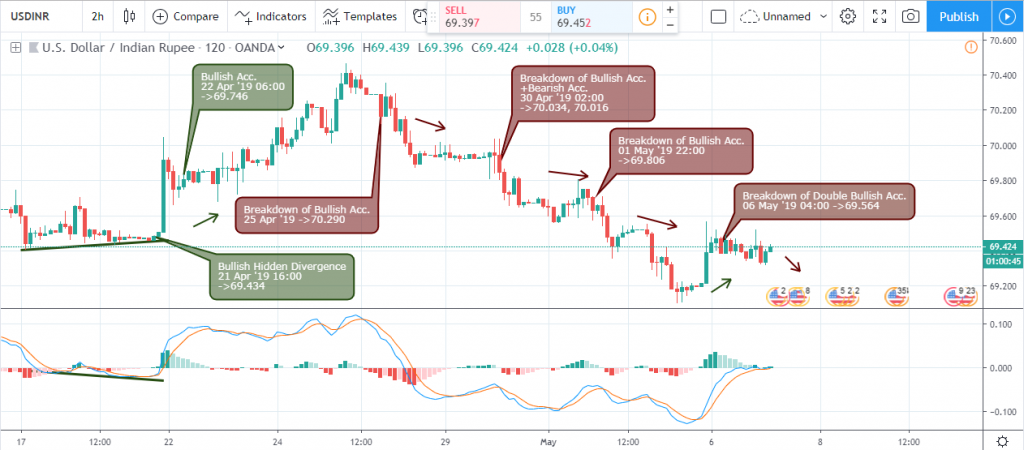
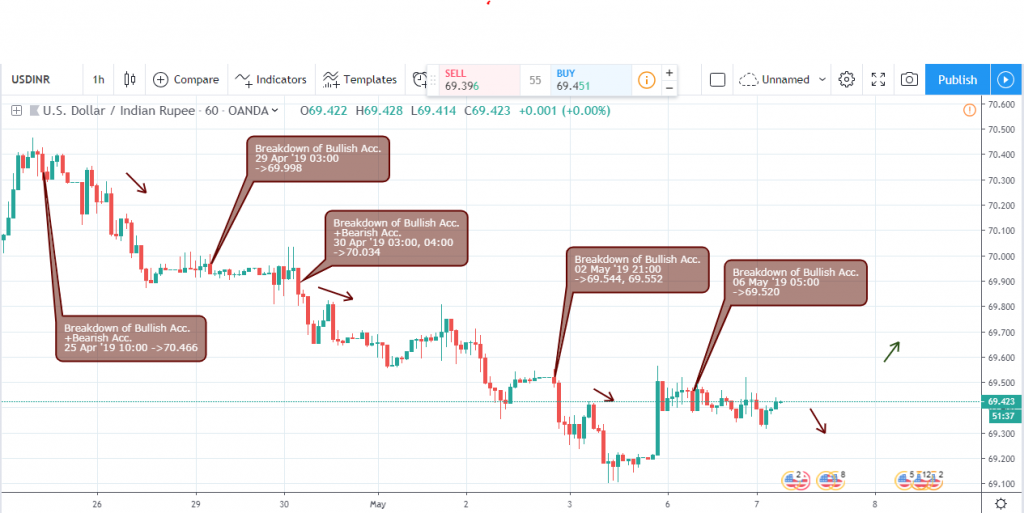
A view from the lower 2hour and 1hour time frames present more convincing price patterns for the pair, starting with a bullish hidden divergence on 21 April ’19 16:00 as the price increased by 1.36%.
An opposite collapse of buying pressure on 30 April ’19 02:00 in combination with selling pressure forced the pair to be southbound, thereby increasing the strength of the Indian rupee.
On 05 May ’19 20:00 a breakout of hidden bearish accumulation got the pair prepared for a bullish run as shown on IQ Option India platform.
USDINR 1HR Chart
Conclusion and Projection
In the face of a dead cross of MACD on the monthly chart, the USD/INR threatens to flag buying pressure at the closing price of May ‘19.
Although the bulls threaten to restore the longer bullish trend of the USDINR, the MACD dead cross confirms a bearish regular divergence.
We look out for breakdown and breakout of buying and selling pressures from the lower 2hour chart, all the way up to the monthly charts for entry setups.

No Comments found