USDINR – Weekly Outlook for November 21 2019
USDINR Forecast & Technical Analysis
Introduction
We’ve been following the marker trend dynamics of the Indian Rupee for a while on Binomo India platforms and it’s obvious the Greenback is becoming increasingly dominant against the INR.
Let’s take a look at the charts and key macro-economic events for this week.
India’s Fundamentals
India Bank Loan Growth
Bank Loan Growth is an evaluation of any changes in the total value of outstanding bank loans given to businesses and consumers.
Borrowing and spending show consumer confidence, which is a major indicator of economic health.
If the reading is greater than anticipated, we conclude that it is bullish for the Indian Rupee. When the data reading is lower than forecasted, it is considered as a negative or bearish trend for the currency.
The latest data released November 8 predicts a positive outlook for INR with the previous figure at 8.8%, while the actual is 8.9%.
U.S. Existing Home Sales
Existing Home Sales is the evaluation of variations in the yearly number of existing residential buildings sold during the previous month. The indicator helps to evaluate the health of the U.S. housing market and a key role in measuring overall economic strength.
If the reading is greater than anticipated, we conclude that it is bullish for the INR. When the data reading is lower than forecasted, it is considered as a negative or bearish trend for the currency.
The latest data released on October 22 predicts a positive outlook for USD with the previous reading at 5.50M, the actual reading at 5.38M, while the forecast figure was 5.45M.
USDINR Technical Analysis
USDINR Long term Projection: Bullish Swing
Monthly Chart
A view from the monthly time frame reveals our observation in the introduction. The USD to INR exchange rate did not need to touch the MA-50 Moving Average before springing upwards.

From the close of the July 01 pin-bar formation, the bottoming got confirmed with the USD attaining gains of about 6.31% from the July 01 low.
After last month October 01 bullish closing inside bar pattern, the month of November projects a close above the 71.56 high to continue higher into the end of Q4.
Weekly Chart

The double bottom formation on November 04 after a bounce off the 50-period MA on September 30 ’19 70.194. If the current month close within last month’s high-low range, we may well be on our way for new highs. However, attaining the September 02 High 72.424 may assume the structure of a double-top, a popular pattern among chartists.
USDINR Medium Term Projections: Price Correction (Bullish)
Daily Chart
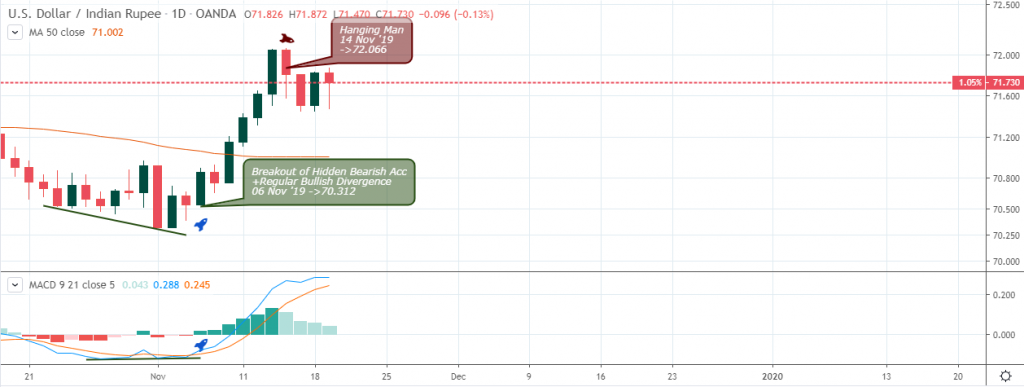
A convincing chart pattern for this month’s price hike is the regular bullish divergence flagged on November 06. The pattern, in combination with a breach of bearish resistance is of high probability presenting a 2X risk to reward.
4HR Chart
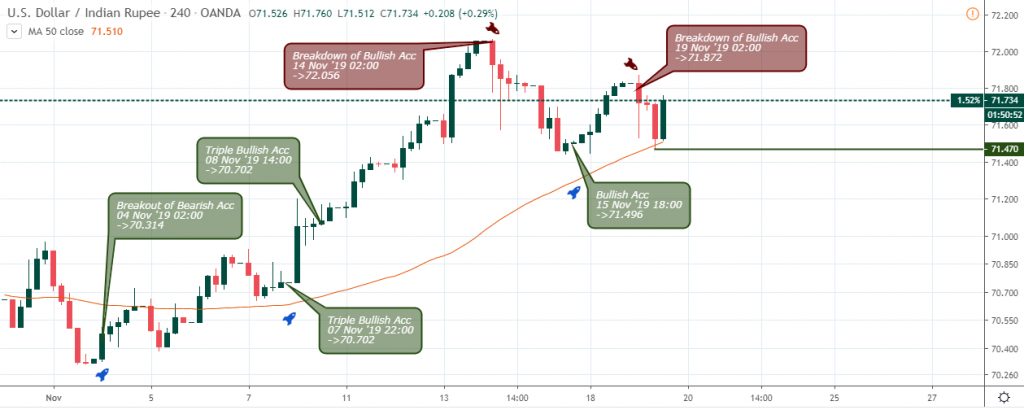
A more clinical entry setup with relatively low risk is a similar break of resistance like that of the daily time frame. Here the reward to risk ratio of about 10X. The bulls added to their position on November 07 22:00 and 08 14:00 for an extra 8X and 6X entry points respectively.
Conclusion and Projection
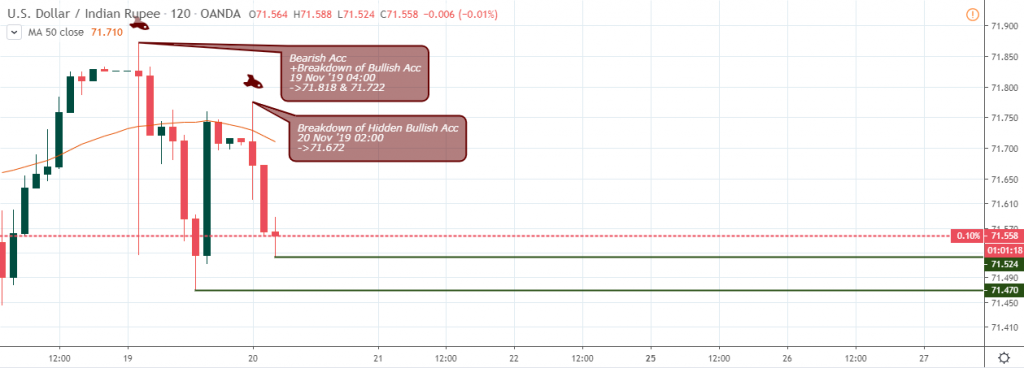
While the higher time horizons maintains a strong bullish outlook, the 2hour overview flags a bearish swing for the quick scalp trades.
USDINR H2 TF

No Comments found