USDINR – Weekly Outlook & Analysis for June 10 2019
USDINR Forecast & Technical Analysis for India Traders
Introduction
The recovery process for each country differs, and they are doing their best to recover fast. The India forex market is the most hit during the coronavirus crisis, and it concerns IQ Option platform because Indian rupee has lost so much to the US dollar.
Let us look further into the chart for the possible outcome of direction shortly, which will induce decisions for online brokers and investors.
India’s Fundamentals
Investors are shying away from Indian rupees because it was severely affected by the pandemic crisis and the ongoing trade war between the US and China.
The Chinese government weakened its currency (yuan) beyond 7/dollar to offset the new tariffs imposed by the US government.
U.S. Fundamentals
The US data on CPI is a good measuring tool to access the health of the country’s economy through the information gotten from the average price paid for consumable goods and services by the urban consumers within the US and its geographical areas such as utilities, automobiles fuel, and food items.
If the Actual data released is greater than forecasted, it is good for the currency, but if it is lower, it isn’t good for the currency.
Previous data released was -0.8%, Forecast is 0.0% while we wait for it to release the Actual.
USDINR Technical Analysis
USDINR Long term Projection: Bullish
Monthly Chart

Monthly Resistance Levels: 77.0080, 75.5800, 74.9450,
Monthly Support Levels: 63.2500, 66.8113, 68.3075
For the past two months, you can see that the Double bullish accumulation of 01.0.2020 failed to take the price of USDNIR up above the 77.0080 resistance level. As the new month unfolds, investors will know their faith.
However, we can see long bearish divergence building up from the previous high and the recent high in line with the stochastic oscillator indicator, which has equally formed a high and a lower high to conform to the chart for a possible change of trend.
As events unfold in this new month, we will see the result of the coronavirus pandemic packages. We may see USDINR close below the 77.416 level, taking price back to the previous support of 1st June 2019 (68.3075), making gain against the US.
Weekly Chart

Weekly Resistance Levels: 77.416, 75.820, 73.990
Weekly Support Levels: 68.346, 70.194, 72.066, 74.214
After the breakout of the weekly congestion resistance (72.066) of 11th November 2019, the USDINR entered a bullish trend for weeks before going into a range.
The market has been in a bullish accumulation range as at 16th March 2020 (77.416), hoping for another surge to the upside. Technically, we can see that the market is ranging from the weekly chart from the resistance of 77.416 and support of 74.214.
For some weeks back, there was a buildup of bearish accumulation range (27.04.2020), and the price has been ranging between the 75.820 and 74.214 zones. A close below the support will expose the 72.066 level.
USDINR Medium-Term Projections: Bullish with High Volatility
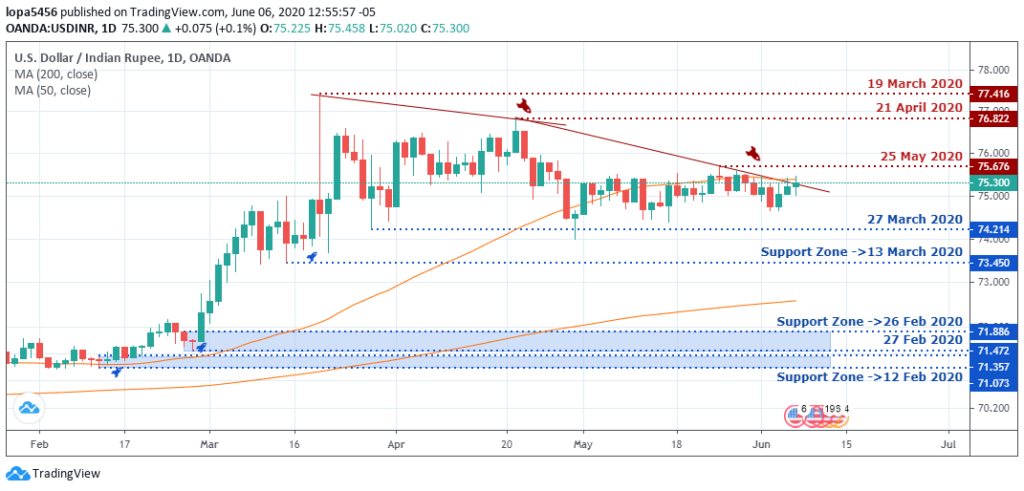
Daily Chart

Daily Resistance Levels: 75.676, 76.822, 77.416
Daily Support Levels: 71.073, 71.357, 71.472, 71.886, 73.450, 74.214
The resistance levels of USDINR has been on a steady drop from 19th March 2020(77.416), 21st April 2020 (76.822) and 25th May 2020 (75.676), respectively, while price rose from the support level of 13th March and 27th March 2020 (73.450,74.214).
USDINR has two psychological zones that institutional traders are observing, 71.214 and 73.450 zones. The psychological zone for investors should price closes below the support will bring in more sellers to push the price to the next level of 71.886.
4HR Chart
4Hour Resistance Levels: 75.458, 75.572, 75.676
4Hour Support Levels: 73.990, 74.468, 74.654, 75.000
For a while, the USDNIR has been trading within price resistance areas of 75.458, 75.572, and support of 74.468, 74.654, a ranging zone.
The online brokers are uncertain about the events happening in the Indian forex market because of uncertainties and the effects of the pandemic on the economy. Traders will be advised to trade with caution to avoid being on the wrong side of the market.
Bullish Scenario:
A bullish scenario is the major direction of price on the weekly time frame. If the bulls rally closes above the 75.572 level on the H4, we may experience another bull’s surge in the coming days.
Bearish Scenario:
However, the resistance level has been attracting bearish sentiment over the weeks as lower highs keep building upon the weekly time frame. The H4 resistance zone has been holding for a while at the 75.572 level rejecting the bulls’ pressure to the upside.
Until the market breaks out of the mid-term range position, the long term bearish position is uncertain.
Conclusion and Projection
The mid-term projection of USDINR is a stalemate between the bulls and the bears in the Indian forex.
Investors, online brokers, and Institutional Traders will be counting on firm fundamental news to give the USDINR a direction.

No Comments found