USDINR – Weekly Outlook & Analysis for March 21 2019
USDINR Forecast & Technical Analysis
Introduction
The Indian Rupee is not spared from the USD dominance as global traders and investors, including those on India forex, find shelter in the United States dollar following a worldwide increase in death count from the COVID-19 virus.
Let’s move on to analyze the impact of some other fundamental indicators as well as technical chart patterns and levels driving the exchange rate of the USDINR.
India’s Fundamentals
India Wholesale Price Index (WPI) Inflation YoY
The Wholesale Price Index (WPI) is an evaluation of changes in the price of goods sold by wholesalers.
A lower than expected data is rated bearish for the currency, whereas a bullish emotion can be scheduled for the currency when data values are higher than anticipated reading.
The latest data released on March 09 indicates that a bearish outlook expected for the USD as the actual reading is 2.26%, the previous reading is 3.10%, and the forecast data value is 2.65%.
U.S. Core Retail Sales
The Core Retail Sales index evaluates the change in the total value of sales at the retail level in the United States, excluding automobiles.
It is valuable in determining consumer spending.
A lower than expected data is rated bearish for the currency, whereas a bullish sentiment can be expected for the currency when data reading is higher than expected reading.
The latest data released on March 17 indicates that a bearish outlook expected for the USD as the actual reading is -0.4%, the previous reading is 0.6%, and the forecast data value is 0.2%.
USDINR Technical Analysis
USDINR Long term Projection: Bullish
Monthly Chart

The USDINR exchange rate finally surges above the 01 Oct ‘18 all-time high this week as traders find refuge in the US dollar as fear, uncertainty, and doubt from the coronavirus outbreak hits global economies.
A regular bearish divergence is anticipated on the monthly time frame as the pair enters the overbought area. However, we still maintain a bullish outlook from this time horizon in line with the golden cross of the stochastic oscillator on 02 Sep ’19.
Weekly Chart

After a bearish price close and an exit of the overbought zone last week, the bulls skyrocket the exchange rate of the USD to Indian Rupee beyond the 74.528 resistance.
The bullish thrust was ignited from a breakout of a minor horizontal channel formed between 04 Feb ’19 and 23 Sep ’19.
USDINR Medium Term Projections: Bullish with High Volatility
Daily Chart
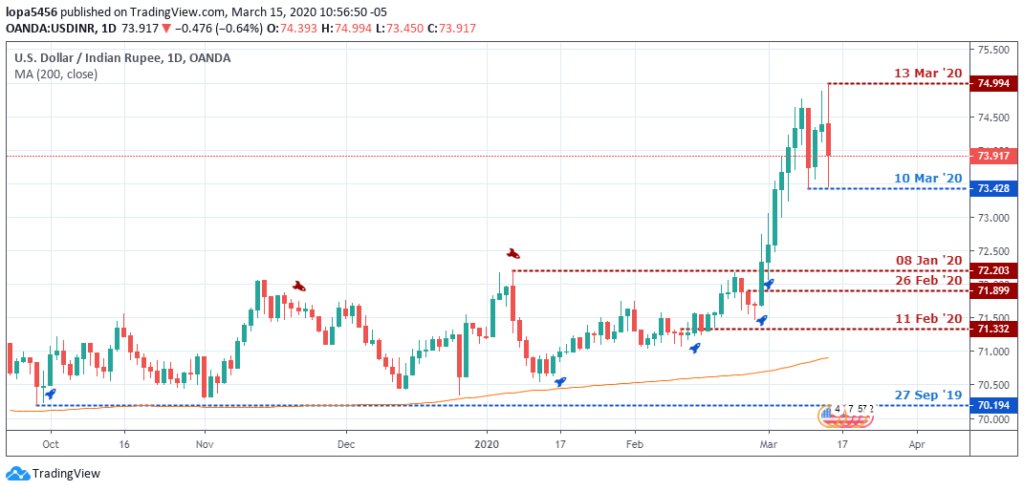
After a highly bullish and volatile session within the 10 Mar ’20 and 13 Mar ’20, the USDINR sets up a bearish stochastic divergence at press time with a threat geared towards a price retreat.
At this point, bulls should look towards speedily scaling out of their open long orders and taking out their profits.
H4 Chart
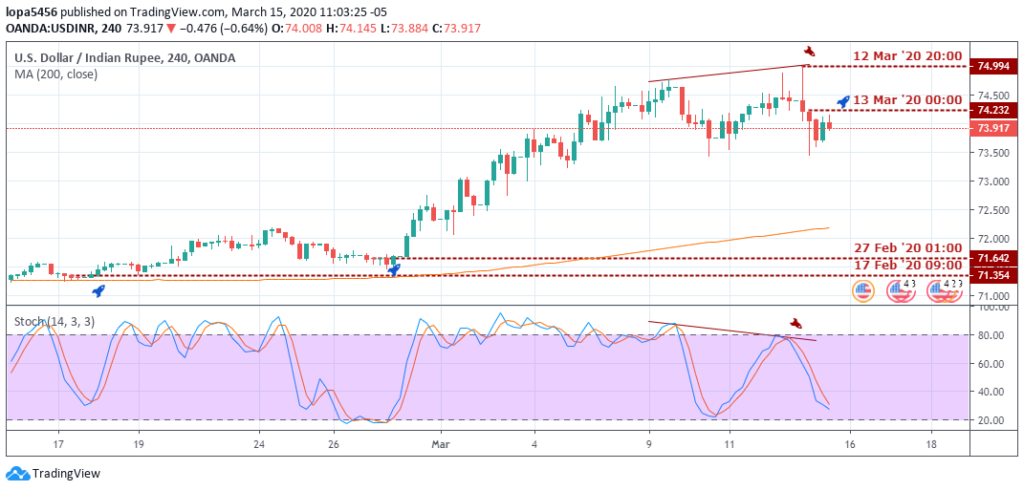
While the daily time frame shows signs of a slowing in bullish momentum, the above 4hour time signaled a regular bearish divergence that eventually gave in to buying power.
A breakout of significant resistance and exit of the stoch-oscillator’s oversold at press time shows that we may be able to take a buy position for a short term holding.
Conclusion and Projection
In summary, the USD to INR has been bullish for the week, and we should only look out for only short term holding trades going forward into the following week.

No Comments found