USDINR – Weekly Outlook for January 24 2019
USDINR Forecast & Technical Analysis
Introduction
Traders holding positions on XM forex platforms are risk-averse in the long term as the Indian Rupee shows no strong sign of a major trend on the higher time horizons.
This week, we take a closer look into the technical chart patterns that set up these support and resistance levels and touch on some news events that may be significant movers of the exchange rate.
India’s Fundamentals
India FX Reserves (USD)
A foreign exchange reserve, which comprises holdings of SDRs, foreign currency assets, gold, and reserve position in the IMF, is a valuable precaution for nations open to financial crises. It can be used to mediate in the exchange market to determine or set the exchange rate.
The reserves are also used to settle the balance of payments deficits between nations
A higher than expected data reading is positive for the INR, whereas a lower than predicted text is negative for the currency.
A bullish outlook can be expected for the INR based on the most recent data, which shows that the actual reading is 461.21B, and the previous reading is 461.16B.
U.S. Initial Jobless Claims
Initial Jobless Claims is a weekly index that evaluates the number of persons who were listed for unemployment insurance for the first time within the past week.
A higher than expected data reading is negative for the USD, whereas a lower than predicted text is positive for the currency.
A bearish outlook can be expected for the USD based on the most recent data, which shows that the actual reading is 204k, the forecast is 216k, and the previous reading is 214k.
USDINR Technical Analysis
Long term Projection: Bullish and Correcting
Monthly Chart

Above is a monthly time frame illustration of the USDINR showing how the Indian Rupee struggles for dominance, as the pair trades within two ranges. The major range being the Oct ’18 (74.528) to Jul ’19 (68.123) range, and minor range being the Sep ’19 (72.424) to the Jul ’19 (68.123) range.
A collapse of the Nov ’19 support would be a signal to consider short-selling the USDINR. On the other hand, a close above 72.424 would validate an expansion of the bullish trend.
Weekly Chart

Similarly, the weekly time frame also shows the USD to INR forex pair in a tight range for about twenty weeks now, with no signs of a breakout in view.
A price close above or below either the Sep 02 ’19 resistance or the Sep 23 ’19 support should confirm an intermediate trend direction. For now, the pair advances to trade inside the range.
USDINR Medium Term Projections: Bearish and Bottoming
Daily Chart
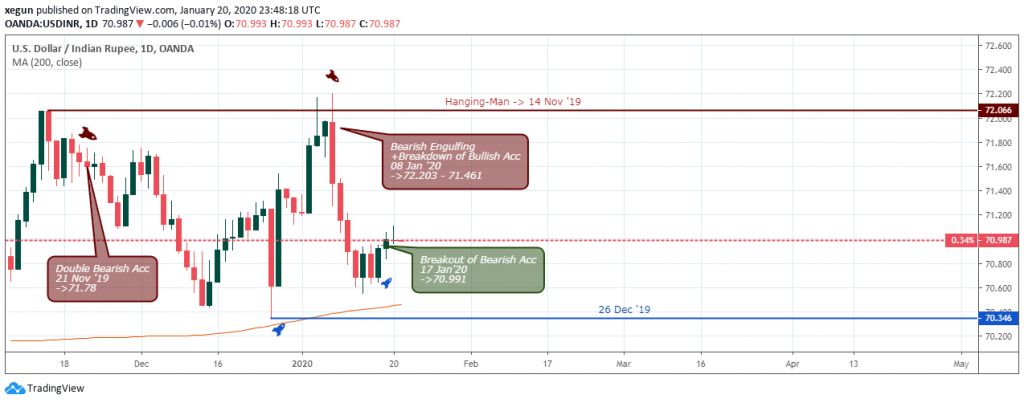
The USDINR find support on the MA-200 from a daily chart point of view, bouncing of the level and headed towards the 72.066 resistance.
The Nov 14 ’19 hanging man Resistance is significant because it is at this level that the Jan 08 ’20 bullish move got rejected.
4HR Chart
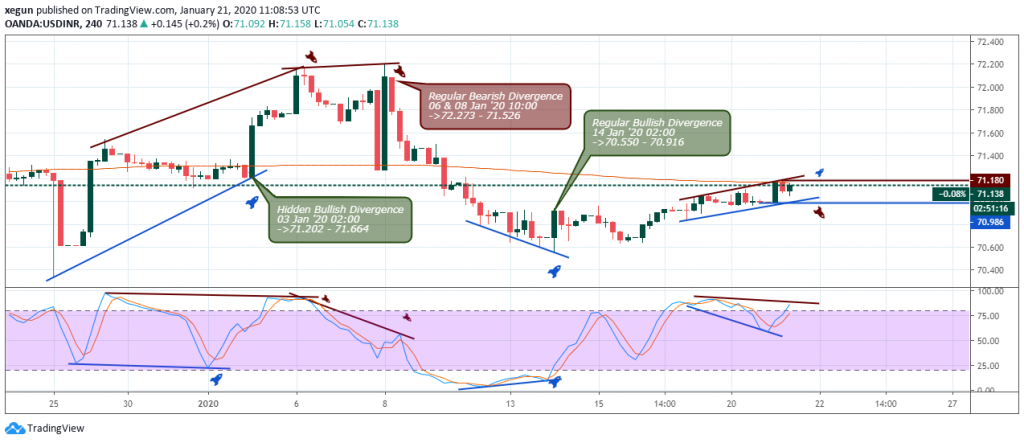
ascending channel, formed by both bullish and bearish divergence setups on Jan 03 ’20 02:00 and Jan 06 ’20 10:00 respectively.
The regular bearish divergence on Jan 08 ’20 was the last straw that broke the support levels, sending the exchange rate down by roughly 1.71% and trades below the 200-H4 Moving Average.
The pair again finds resistance at the MA-200 while signaling a regular bearish divergence for a short term bearish move at press time.
Conclusion and Projection
To summarize, the USDINR offers an opportunity for mean reversion based trading strategies at the moment. However, an attempt to adopt a trend following trading methodology at this point would spell doom for a traders’ account.
We, therefore, lean towards risk-averse trading mindset till a breakout of the long term horizontal channel is established.

No Comments found