How to trade using Relative Strength Index (RSI) Indicator?
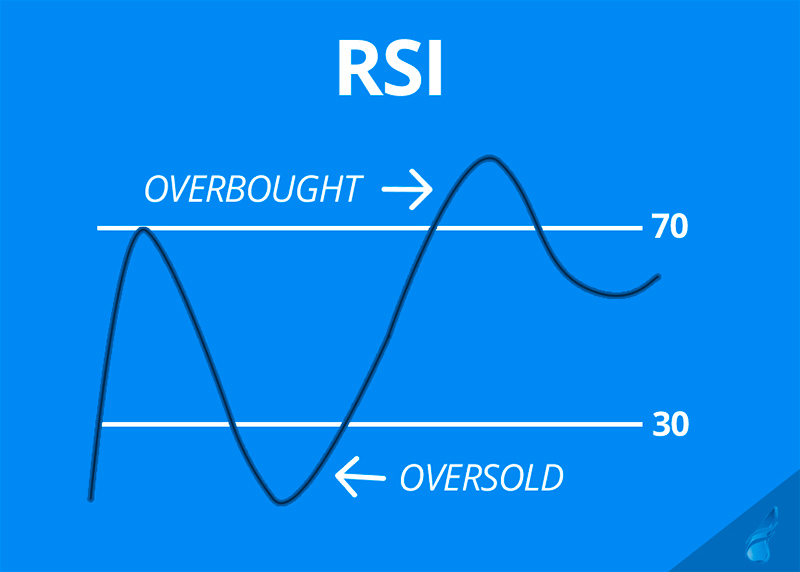
The RSI or Relative Strength Index is essentially a technical indicator, which moves backward and forward between 0-100 and offers information regarding the weakness or strength of the asset/stock prices. The RSI is utilized for various purposes such as for confirmation of trends, offering trade signals as well as foreshadowing the reversals. Here, discover how to trade with RSI and also learn more about its strengths as well as limitations.
Relative Strength Index-What is it?
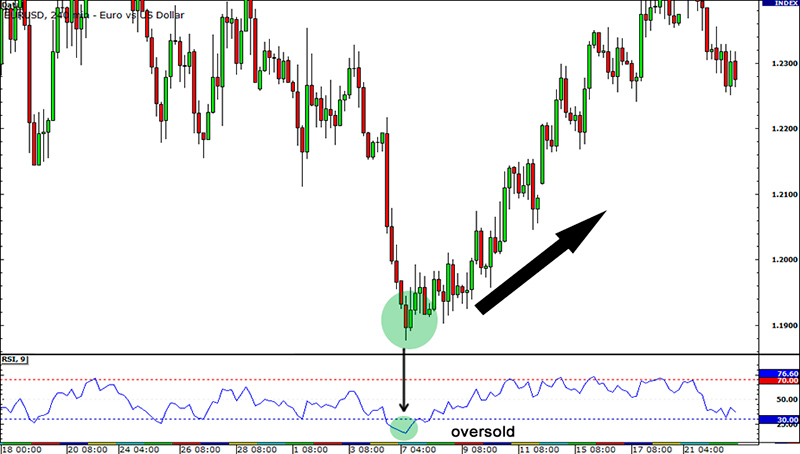
Designed by J. Welles Wilder, the RSI indicator is one of the most popular technical indicators. The indicator goes up when the average profits are larger in comparison to the average losses. On the other hand, the indicator drops down if the average losses are more than the average gains. It is primarily used for indicating whether the market conditions are temporarily oversold or overbought. Hence, traders can use the RSI indicator to conduct accurate technical analysis as well as to understand whether the market conditions are overextended and could retrace in future or not. When the value of RSI is more than 70, it indicates that the market is overbought and when the figures are below 30, it implies that the market is being oversold.
A good number of financial analysts as well as traders prefer using the extreme figures of 80 as well as 20. This is because a sudden as well as sharp movement in price can move the indicator up and down on a repeated basis, which in turn may provide traders with false market signals. Additionally, the price of an asset may continue to move beyond the level where the indicator had first stated that the market was being oversold or overbought. This is precisely why, when it comes to trading, traders shouldn’t rely on the RSI indicator alone. Instead, they must combine it with other technical and market analysis as well as reports to achieve best results.
How to Trade With RSI?
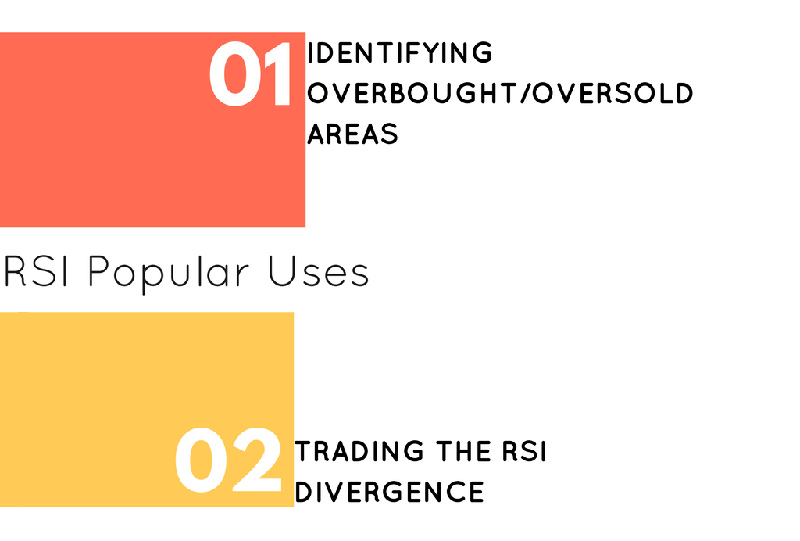
Traders must combine the Relative Strength Index with other technical analysis for creating a desired trading strategy. In fact, they can use the RSI in multiple ways. In order to trade successfully, forex traders need to keep a track of the oversold/overbought levels, RSI range as well as divergence. Hence, when the Relative Strength Index is over 70, it indicates higher and strong price run that may not sustain for too long and may therefore witness a correction. Similarly, when the RSI is under 30, it indicates a strong lower run and the pricing may thus witness a rally.
Traders can wait for the price to drop under 30 and later rally above that level before purchasing. On the other hand, when it comes to selling, they must allow the pricing to cross 70 and drop below later. However, this method works well when it comes to range trading wherein the prices are constantly swinging backward and forward between oversold as well as overbought levels. Apart from this, traders must also understand that it isn’t necessary that the price will always reach the 30 or 70 levels. Thus, when the price does not touch the levels that have been pre-defined, traders can use other levels like 35 or 65.
RSI Buy and Sell Signals
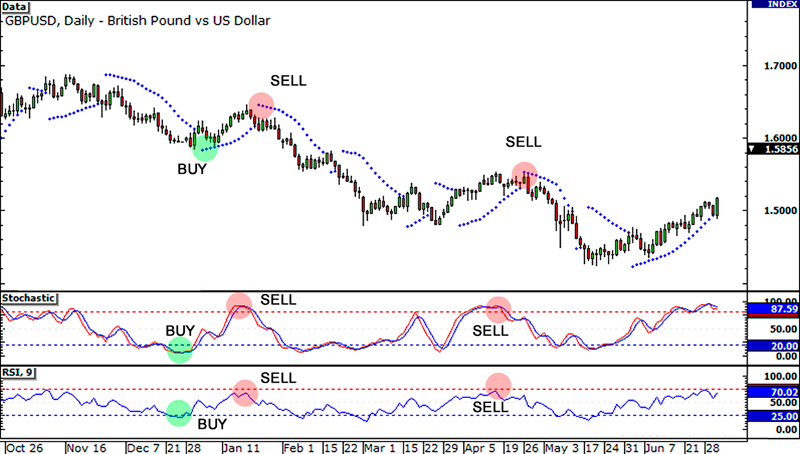
The Relative Strength Index will continue to remain within specific readings or ranges during market trends. In fact, when the market is witnessing an uptrend, the indicator drops above 30 and will continue to touch 80 plus levels. On the other hand, during downtrend, the RSI indicator will reach 70 and continue to touch 20 or even below. Traders can use this strategy to confirm market trends and also assess their entry point during trends. Forex traders must therefore purchase the asset when its price goes under 35 or 40 and later rallies to go beyond it. Similarly, they must sell only when the asset price has gone over 70 or 80 and later drops down below.
However, it is important to understand here that the indicator does not necessarily provide traders with a signal for exiting. In this case, their successful trades may convert into an unsuccessful or lost trade. During such cases, traders must establish a pricing target or a method for exiting. Traders must also realize that every stock behaves differently, which is exactly why they will always have a different trading range. It is advisable that they adjust the levels in accordance with the movements of the individual asset/stock.
RSI Indicator for Long and Short Entry
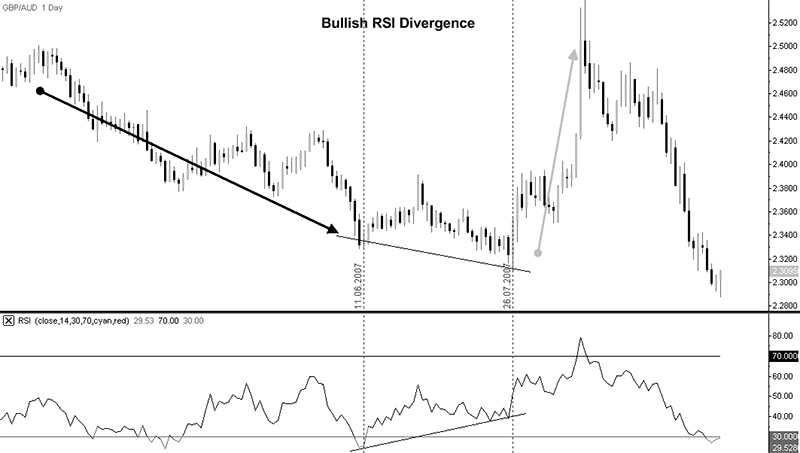
When the market is experiencing a downtrend, traders must short sell as and when the price of the asset rallies beyond 65 and later drops below. Here, traders must place their stops right above the recently recorded high price. They must also cover their short position as and when the asset price drops under 30 or 20 and later rallies above that level.
The RSI indicator is used for spotting divergence too. When the prices are rising, RSI drops and the divergence is bearish in nature. It signals that the price would soon witness a lower correction, as the momentum around purchasing is gradually slowing down. Thus, divergence is helpful in confirming other types of signals and also informs traders when a particular trend would almost come to an end.
Divergence is bullish when asset price drops but the Relative Strength Index continues to rise. This signals that the asset price would soon go higher as the momentum for selling slows down. Thus, divergence that takes place around major market trends signals a complete change or overhaul in the direction, whereas divergence on small trends could indicate a smaller correction in the market direction.
Final Words
The Relative Strength Index has gained a great deal of popularity because it can be used in multiple ways. It is used for identifying market entry as well as exit levels and signals on the basis of oversold or overbought figures and ranges. It also helps traders in spotting or confirming trend reversals through divergence. Like other technical indicators and analysis tools, the Relative Strength Index may also provide false trading signals. Therefore, traders must conduct an analysis of the price for determining whether a trend truly exists or not. Also, traders often feel that it is best to purchase assets with the highest level of relative strength. However, contrary to their belief, traders must use the RSI for identifying the assets that have just begun to break out of the sideway range. Besides, the ideal time to sell off an asset is only after it has moved out of that range with overbought RSI figures. Apart from using the indicator for placing their trades, traders must also use an appropriate strategy for risk management.