How to use Bollinger Bands effectively?

Bollinger Bands are a chart based indicators that were designed by John Bollinger and are used for measuring the volatility levels within a market. Traders, irrespective of whether they engage in stock, forex and bonds trading need to use Bollinger Bands to trade effectively. In fact, a good number of traders use Bollinger Band for determining oversold and overbought levels. As a result, they sell when the price reaches the upper Bollinger Band and purchase when it reaches the bottom Bollinger Band. However, this strategy works well in range trading as Bollinger Bands do not always provide accurate buying and selling signals. Read on to find more about Bollinger Band trading strategies.
Bollinger Bands Explained

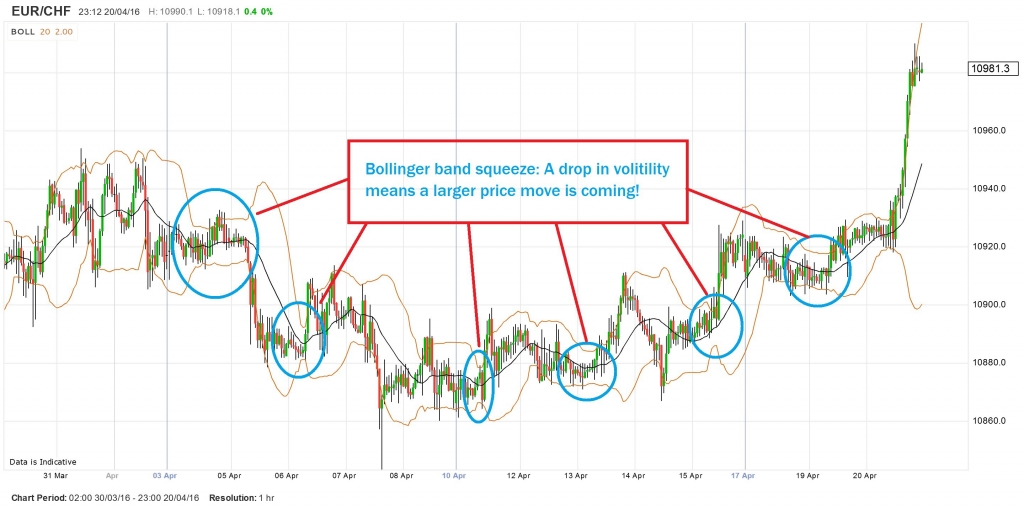
For effective Bollinger band trading, traders must first determine how the strategy works in addition to understanding their varied applications. As already stated above, Bollinger Bands are a technical indicator used for gauging market volatility. These bands are essentially made up of three different lines. It consists of a lower, middle as well as upper band. The bands continue to move as price fluctuates and narrows or widens with an increase or decrease in volatility. Traders can thus gauge the market conditions as well as the strength of the trend by assessing the position of each and every band and the manner in which the price behaves with regard to the Bollinger Bands.
These bands are utilized in each and every timeframe like hourly, daily or even 5 minutes trading charts. They feature two distinct settings that can be easily adjusted in accordance with the trader’s trading strategy and style. These include Period as well as the Standard Deviation. The Period setting indicates the number of price bars that are used for Bollinger Band calculations. Typically, traders use 20 periods, however, they can increase or decrease the number of periods in accordance with their trading style and methods.
On the other hand, the Standard Deviation setting is usually kept at 2.0 and is used for determining the width of each and every band. As a result, a high Standard Deviation will make it difficult for the asset price to touch the lower or upper band. Similarly, if the Standard Deviation is lower, the price will easily breakout of the Bollinger Bands.
How to Trade with Bollinger Bands?

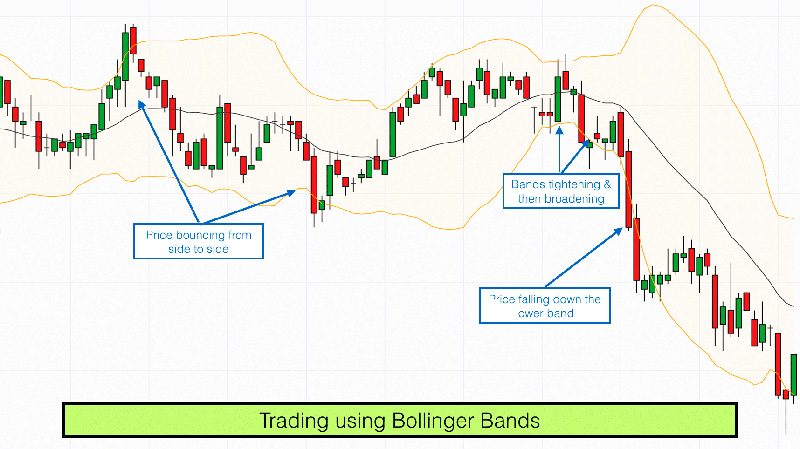
Traders can use the Bollinger Bands in multiple ways. To begin with, they can use it for analyzing the market conditions and trends. A couple of common incidents and occurrences give traders enough information around the strength as well as direction of the market trend. Traders can use these information and details for confirming signals using other technical indicators as well strategies and place their trades only after they’ve taken all the factors into consideration. In case of a strong uptrend, the signal will touch the upper band regularly. This also indicates that the asset is moving higher and the purchasing activities are extremely strong. When the market is experiencing an uptrend, the asset price should not drop below the lower Bollinger Band. In case that happens then it implies that the uptrend is slowing down and could reverse gradually.
Analyzing Trends via Bollinger Band
During a strong downtrend, the price will touch the lower Bollinger Band regularly. This further indicates that the selling activities are really strong. Hence, during downtrend, the asset price should not break over the upper Bollinger Band. When it happens, it would indicate a slowdown of the uptrend as well as a trend reversal. Traders must adjust these bands to analyze the trends appropriately. In fact, they can adjust the Bollinger bands for acquiring true trading signals using the above mentioned guidelines.
W Bottoms and M Tops

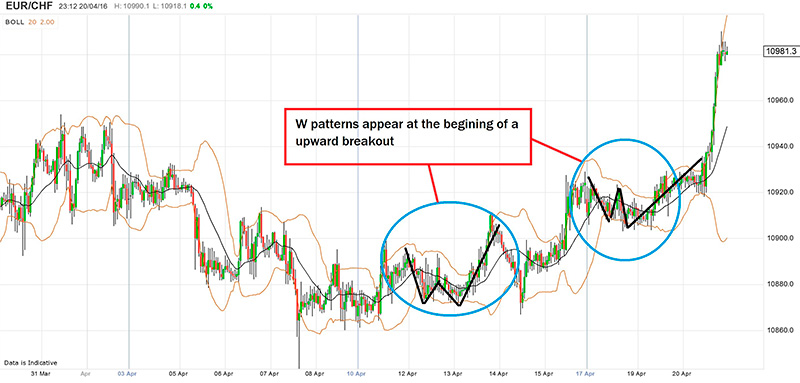
W Bottoms and M Tops are other exciting ways of using the Bollinger Bands for trading. Thus, W Bottom indicates a reversal wherein the downtrend converts into an uptrend. At the beginning traders may witness a lower wave that later moves close to or below the lower Bollinger Band. The asset price later pulls back to touch the middle Bollinger band or even higher, which creates a lower asset price that is lower in comparison to the previous wave but does not close under the lower band. As and when the asset price goes up beyond the higher levels of the previous pullback, a W Bottom is formed. As a result, traders go long and place a stop right under the recently registered low levels.
The M-Top, on the other hand, indicates a reversal of trends from uptrend to downtrend. At the beginning, a higher wave reaches close to above the upper Bollinger Band. The asset price later pulls back to touch the middle Bollinger Band or even lower and later results in a high price that is higher in comparison to the previous wave. However, it does not close over the upper band. After the asset price drops below the lower level of the previous pullback, an M Top is formed. Traders thus need to go short and place stops right over the recently recorded higher levels.
Limitations of the Band
While Bollinger Bands are useful for assessing the market trends and volatility, they also have their own limitations. Since they are based on simple moving average, they react in accordance with price movements but fail to forecast their movements. Hence, they’re reactive and not really predictive. Additionally, Standard setting won’t provide desired results to each and every trader. While, traders who’re more active will need smaller periods or low standard deviation, other traders who’re willing to stay in the market for longer periods could prefer more periods and a higher standard deviation. In fact, traders who adjust the settings may face more difficulty in gauging the market trend using the Bollinger Band guidelines. Apart from this, they may also face issues in spotting the W Bottoms and M Tops.
Conclusion
To sum up, the Bollinger Bands basically consist of middle band (i.e. Simple Moving Average), lower and upper bands, which are further based around standard deviation that may contract or widen in accordance with volatility. These bands are excellent for gauging the strength of market trends and keeping a track of the trend reversal. Traders can combine these bands with W and M pricing patterns for spotting the major trade and reversal signals conveniently. While, these bands aren’t predictive, they’re essentially based around historical data and information. This is exactly why they react in accordance with the changes in price but fail to anticipate any changes in advance. In order to place successful trades, traders must combine Bollinger Bands with multiple technical indicators and trading analysis tools. This would further help them in managing their risks and designing an effective trading strategy or plan.