USD/INR – Weekly Outlook for June 28 2019
USD/INR Forecast & Technical Analysis
Introduction
In the previous week, Olymp Trade record recovery in the strength of the Indian Rupee after the USD/INR established a weekly high of 70.776 INR.
Come along as we look into the fundamental and technical events driving the price.
India’s Fundamentals
India’s FX Reserves is a macroeconomic data published by the Reserve Bank of India in USD, which shows the transaction with formal agencies overseas, foreign security earnings, and Central Bank Foreign exchange sales and purchases.
After attaining an all-time high of 432.58 on 27 April ’18, and a higher low at 392.08, on 02 November ’18, the data maintained a bullish trend, an indicator of a healthy economy, as the previous data of 21 June 2019 was at 422.2B.
United States Fundamentals
US New Home Sales (Monthly)
Here is a fundamental indicator published by the United States Census Bureau measuring the conditions of the US housing market.
It reflects how buyers of houses spend money on finishing and furnishing their homes, which consequently increases the demand for goods and services.
The US New Home Sales bottomed at 0.54 on 28 November 2018, and the previous value on 25 June ’19 was at 0.63.
USD/INR Technical Analysis
Monthly Chart

After peaking at 74.528, the USD to INR exchange rate took a nose dive, forming a long bearish candle on 01 November ’18 and enters a consolidation phase on the monthly time frame.
The current monthly bar should signal a bearish selling resistance if the price closes within last month’s high-low range.
Weekly Chart

A view from the weekly time frame shows rising support levels established at 68.346, 68.602, and 68.954. After the sudden upsurge above the 69.812 resistance level, the USD/INR corrected the upward move and headed towards the support level of 68.602.
Daily Chart
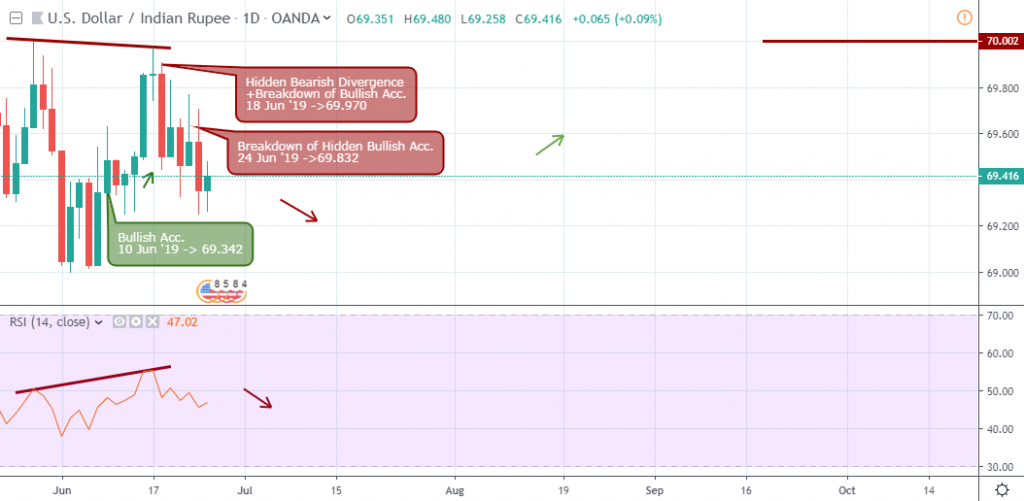
The hidden bearish divergence pattern signaled simultaneously with a failure of bullish support on 18 June ’19 brings clarity to the current strength shown by the Indian Rupee, following a flagged bullish pressure pattern on 10 June ’19, which set support at 69.342.
1HR Chart
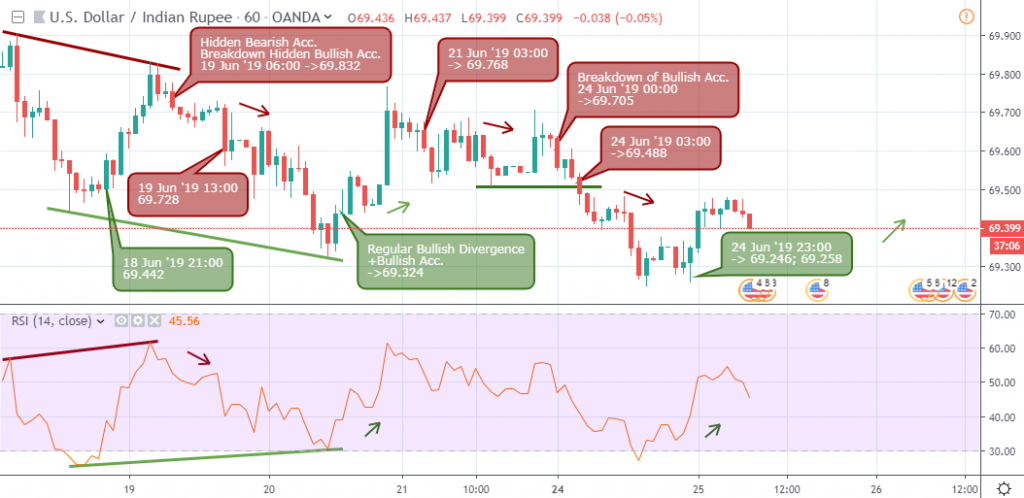
We skip the 4hour chart and head straight to the 1hour time frame, which reveals more interesting swing trading opportunities forming excellent resistance and support levels highly probable market timing.
First was a hidden bearish divergence pattern on 19 June ’19 06:00 followed by an opposite regular bullish divergence signaled alongside an increase in buying power on 20 June ’19 10:00.
The bulls show exhaustion after a break below bullish support on 24 June ’19 00:00 that sent the pair into the oversold region on 24 Jun ’19 23:00.
Above is an update to the 1hour chart, notice the formation of another hidden divergence setup and exit of the overbought region on 25 June ’19 23:00 following a departure from the oversold territory on 24 June ’19 23:00.
Conclusion and Projection
As we approach the last days of the month with the Indian Rupee increasing in strength, we pay attention to an exit of the oversold territory on the 1hour chart for possible profit taking in our short selling position.

No Comments found