Bitcoin to USD ( BTCUSD ) Weekly Outlook , October 9 2019
BTCUSD Forecast and Technical Analysis & Fundamentals for cryptocurrency
Introduction
After making contact with the MA-50 of the Bitcoin dominance chart, we start to see a decline in the price of Bitcoin on the FBS platform. Last week’s bearish price close even hints further price decline towards the $7000.00 round number.
Come along as we uncover exciting news events and technical drivers of the BTCUSD.

BTCUSD – Technical Analysis
BTCUSD: Weekly Chart
Resistance: $10380.07, $10955.48, $13880.00
Support: $7432.84, $4912.00

Last week close bearish within the high-low range of the September 23 price close after the double combo sell pressure on August 26 and September 16. The bearish closing price established another bearish resistance at $8531.25, with a likely continuation of the bearish trend.
BTCUSD: Daily Chart
Resistance: $8244.93, $8746.83, $10441.47, $10542.93, $10949.00
Support: $7714.70

The above daily chart illustrates the bearish trend the pair has been in since the dark cloud cover candlestick pattern on September 06. An increase in bearish momentum intensified the price decline for about 23%, and the bears appear to be taking the price into lower levels somewhere around $7K.
BTCUSD: 4Hour Chart
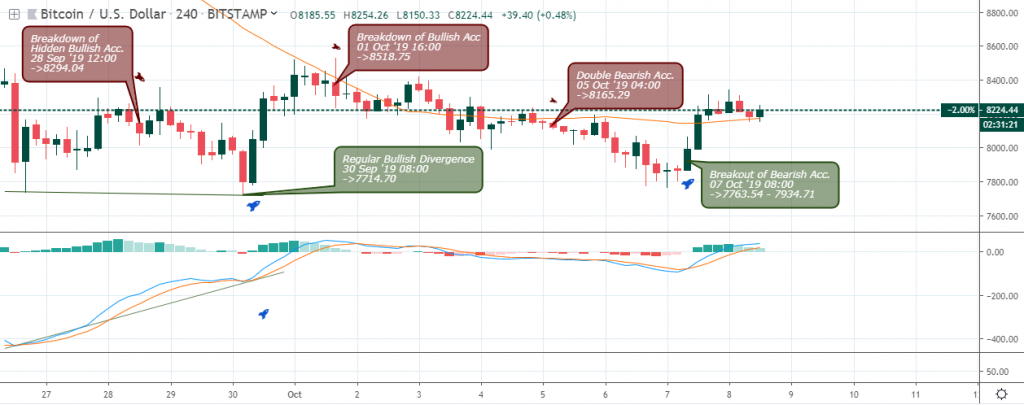
Resistance: $8294.04, $8518.75, $8165.29
Support: $7714.70, $7763.54, $7934.71
The above 4hour overview shows the number one cryptocurrency by market cap in a range-bound market.
Starting with a regular bullish divergence on September 30, the BTCUSD spiked towards the MA-50, where the bullish momentum slowed, and the price crashed back in a bearish formation.
The Bitcoin price trades above the MA-50 at publication time after a break above bearish resistance on October 07 08:00.
Bitcoin Fundamentals
PRICE OF BITCOIN MOVES IN TANDEM WITH S&P 500: TOM LEE
Tom Lee, the co-founder of Fundstrat Global Advisors in an interview with crypto news channel The Block, revealed that Bitcoin (BTC) is undoubtedly related to the S&P 500 market index and does not offer protection against significant economic turmoil.
According to Mr. Lee, the popular belief that Bitcoin is a hedge fund against macroeconomic challenges makes his opinion unpopular. However, while he concedes that some crises can have a positive influence on Bitcoin’s price overall, he still believes that the price of BTC operates not against macro-economic factors, but in conformity with them.
Expressing in the interview, Lee exposed that based on proof, bitcoin, since its initiation had averaged a negative 19% annual return in the years when the S&P has been down.
Lee also noted that in the years during which the S&P index was below its long-term average return, the average gain of Bitcoin was 300%. The average gain of BTC was 1,800% in the seasons, with an index gaining 15% or more.
Bitcoin’s best years, according to Lee, have all taken place at the times where the S&P has performed very well.
Conclusion and Projection
The recent decline in BTC price across top bitcoin broker platforms looks frightening to newbie traders; however, experienced traders know fully well that the pair is setting the stage for institutional traders to stash up some more bitcoin.
A technical setup on the weekly time frame should confirm a bullish campaign.

No Comments found