Bitcoin to USD ( BTCUSD ) Weekly Outlook , September 13 2019
BTCUSD Forecast and Technical Analysis & Fundamentals for Bitcoin
Introduction
Following a bearish closing month of August, with the last three weeks of the month closing bearish and setting resistance level at $10955.48, $10650.00, September opened with a price surge towards the resistance levels and closing bullish last week across crypto broker charts.
Let’s go-ahead to analyze the technical chart pattern and interesting news events that may be driving the Bitcoin price.
BTCUSD Technical Analysis
BTCUSD: Daily Chart
Resistance: $12325.00, $12145.42, $12325.00, $10955.48, $10949.00, $10542.93
Support: $9111.00, $9467.57, $9755.53, $9885.48, $9443.19, $9320.00
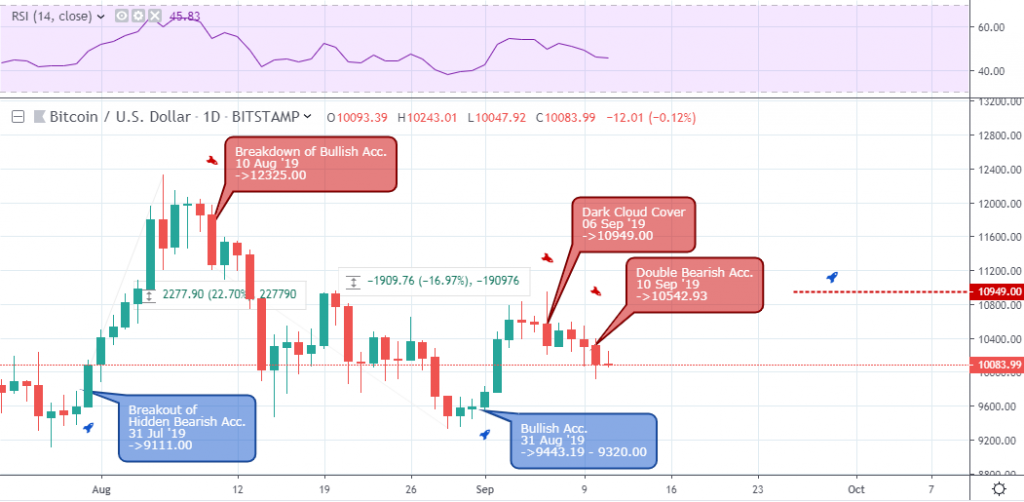
An overview from the mid-term time horizon shows the Bitcoin price in a downward slope forming lower highs. Although the BTCUSD on major Bitcoin broker platforms failed to establish a higher low on August 29 ’19, the price was unable to close below the $9467.57 support of August 15 ’19, still a sign of weakness for a price rally.
The increase in buying power on August 31 sets support at $9443.19, bringing the Bitcoin price to a high of $10949.00. Meanwhile, at press time, the dark cloud cover price pattern on September 06 ’19 forced the BTC price into a collection of resistance levels at $10542.93, $10390.09, and $10243.01.
BTCUSD: 4Hour Chart
Resistance: $10650.00, $10479.00, $10803, $10580.0, $10383.90
Support: $9350.10, $9753.24
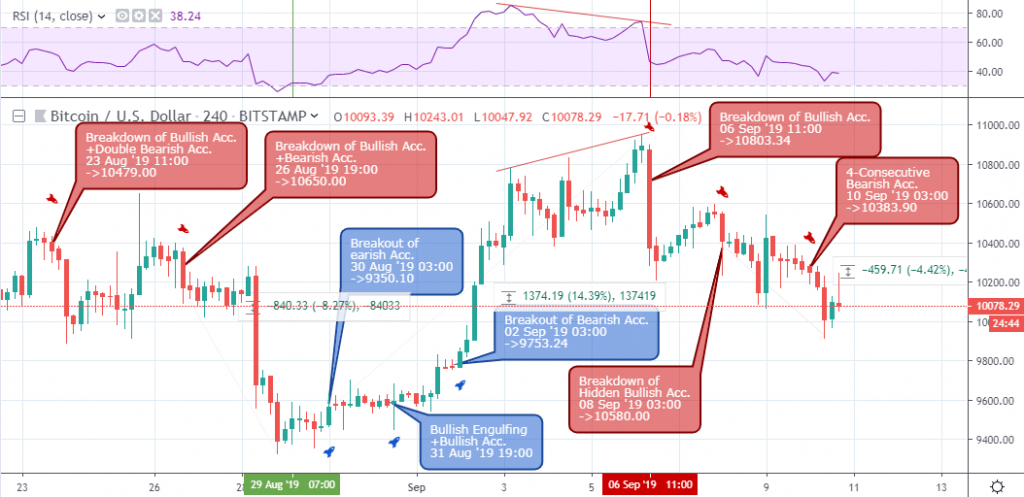
Coming one step lower from the daily time frame, the above 4hour chart reveals a buildup of the bearish and bullish swings, starting from a collapse of support on August 23 11:000, August 26 19:00, to a break of significant resistance on August 30 03:00, 31 19:00, and September 02 03:00.
The recent trend is bearish as the pair signals a regular bearish divergence alongside a collapse of bullish support ($10803.34) on September 06, ’19 11:00.
After a 9.79% bearish decline in the Bitcoin price, the pair at press time starts to show accumulation of sell orders setting resistance levels that are suitable for a breakout to the upside.
BTCUSD: 1Hour Chart
Resistance: $10927.16, $10594.88, $10377.05, $10390.09, $10278.00
Support: $10378.70, $9910.00, $9855.11
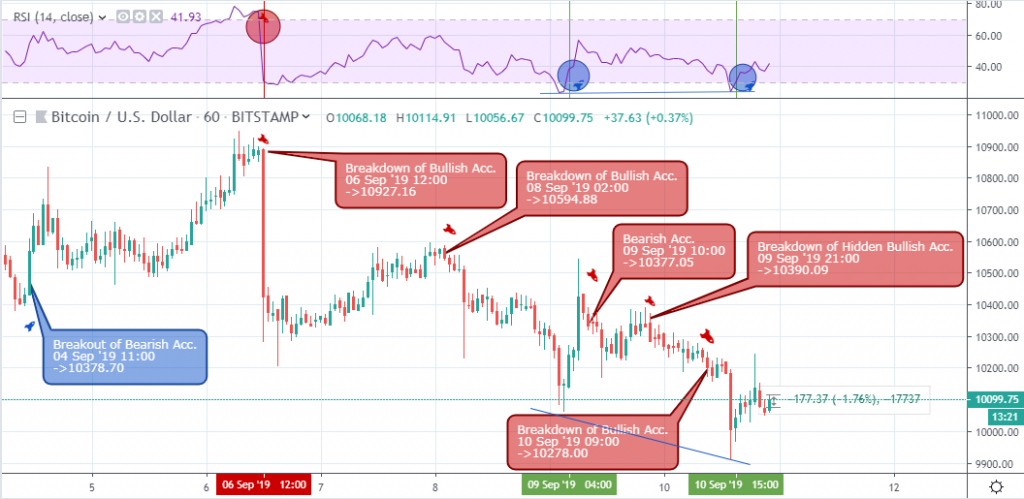
While the 4hour time frame exposes accumulation of bearish resistance levels at the base of a bearish trend, the intraday 1hour chart flags a series of regular bullish divergence setups on September 10 15:00 and 11 02:00, as the price come out of the oversold area.
Bitcoin Fundamentals
Bitcoin Hit Record Inverse Correlation to Chinese Yen in Past Week
According to an analysis by Bloomberg on September 6th, the price of Bitcoin (BTC) has recorded an inverse correlation with the Chinese Yen (CNY) this week. This goes to show that investors are using BTC as a hedge against the falling value of the Yen.
Furthermore, the higher prices being paid in local exchanges when the Yen fell also proves that the cryptocurrency is being used as a hedge in China.
Dr. Hileman of the London School of Economic highlighted that the correlation can also be noticed in the premium price paid sometimes for Bitcoin in exchanges like Huobi that primarily supply China.
The ongoing China trade battle with the U.S and the central bank’s monetary easing policy are factors contributing to the weakening of the CNY against the USD.
In addition to these, Hong Kong businesses are also increasingly embracing Bitcoin as a kind of protest.
Conclusion and Projection
The accumulation of resistance levels on the higher weekly time frame, mid-term daily time frame, and intraday charts are significant obstacles that the bulls must surmount to drive the price higher. If that does not pass by the end of the month, we may be looking at a further slump in the Bitcoin price.
+
No Comments found