BTCUSD Weekly Outlook and Bitcoin Fundamentals , 17th September 2020
BTCUSD Forecast and Technical Analysis & Fundamentals for Bitcoin
Introduction
As the year is entering her last quarter, we may begin to see India brokers, BTCUSD investors, and other institutional traders taking profit to round off the years’ investments.
Should we expect such a move to extend into the Bitcoin market, or will the bullish trend buildup persist? Let’s analyze the charts.
BTCUSD: Technical Analysis
Monthly Chart

Monthly Resistance Levels: 12325.00, 13880.00
Monthly Support Levels: 3122.28, 4265.00, 6425.00, 9825.07, 7772.21
Bitcoin’s price did reach the 12000 levels before it slowed down at the beginning of the month. The resistance levels had sellers at the zones during the new high peak of bitcoin as of June 2019 at 13880.00 before pushing down bitcoin’s cost to the low of 4265.00.
IQ Option broker need to wait for a definite breakout above the resistance level of 12325.00 if they must continue to buy bitcoin. On the other side, a close below the 9825.07 prices will mean that the bears’ pressures should push down bitcoin to 7772.71 and below.
Weekly Chart

Weekly Resistance Levels: 124475.91, 13858.37
Weekly Support Levels: 6472.26, 3901.25, 10517.20, 10699.94
As of March 09, 2020, the regular bullish divergence respected the support levels that lead to the bullish trend for weeks in favor of the bitcoin investment.
The bullish surge was able to close above the resistance level of 10699.94 of February 10, 2020, before another resistance at the 12475.91 level met it.
If the previous resistance can act as a support level, we may see a continuation of a hidden bullish divergence, which may take the bitcoin price higher in the coming weeks.
However, should the support level fail to push the bitcoin up, you shall see the level giving way for the bears to drive down bitcoin to 6472.26 support levels.
Daily Chart
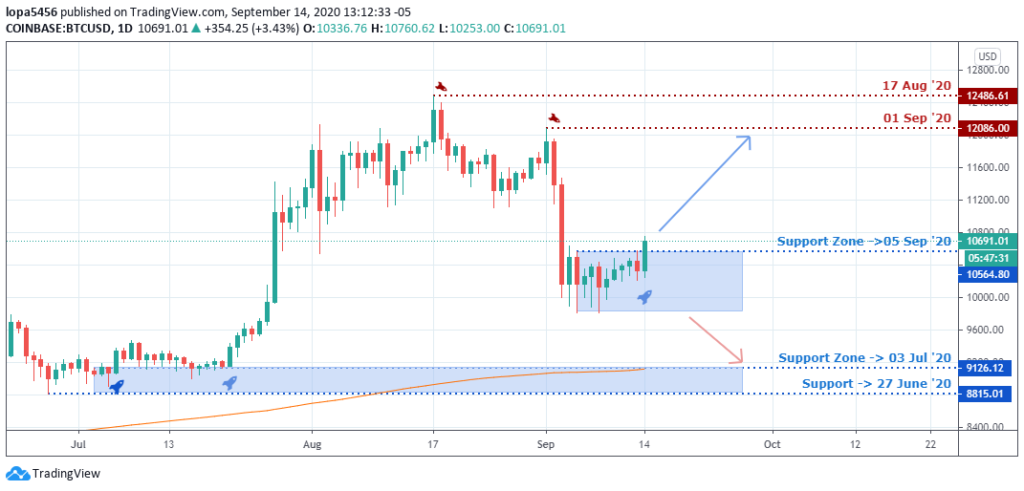
Daily Resistance Levels: 12486.61, 12086.00, 10691.00
Daily Support Levels: 9126.12, 8815.01, 10000, 11200.00
From the daily chart, we can see the bearish swing breaking the support levels of 11200.00 after days of accumulation, which indicates the Bears pressure to the downside.
The breakout market rested for days before the bullish daily candle was closing above the high of the accumulation level at the time of this report. A close above the box will mean a bullish swing to the previous support levels or the resistance level of 12086.00.
A failure to close above the levels of 10691.00 to continue its trend will imply the sellers’ control and may push back the price to break the low of the accumulation levels for a down surge to the 9126.12 support level.
H4 Chart
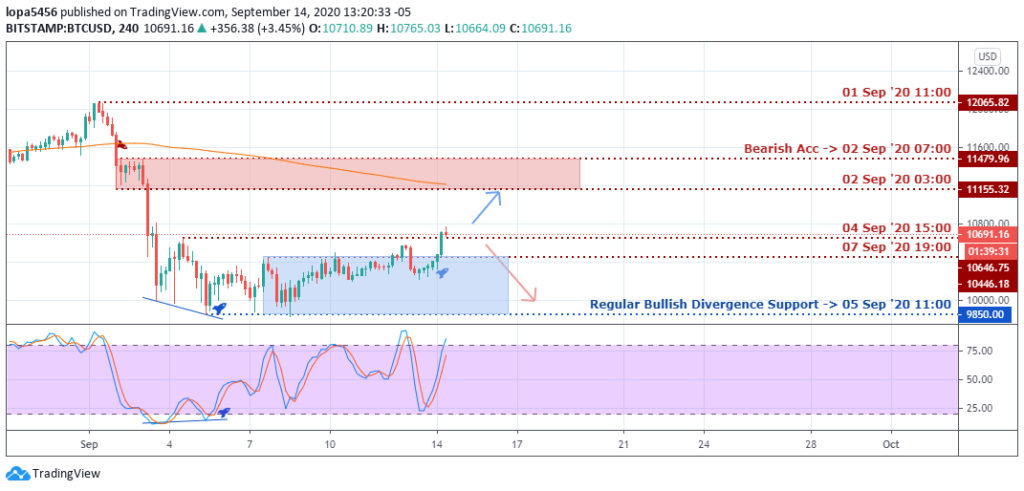
H4 Resistance Levels: 11155.32, 11479.96, 12065.82, 10691.16
H4 Support Levels: 9850.00
As the month began, we can see the bears dominating the market from the high of 12065.82 down to 9850.00 before it went into range.
We expect the bears to reject the bulls approach at the resistance level of 10691.16 to continue the downtrend or a reject at the 11155.32 levels where the bear’s surge is more substantial.
However, a close above the level price will likely attract some bullish run to the high of 11155.32 and beyond should they have the momentum to close above the bearish resistance.
Bullish Scenario:
A possible general bullish scenario can be seen based on the daily time frame if the daily candle close should have a stronger momentum for an upward trend. A close above the 10691.00 levels will take bitcoin higher.
Bearish Scenario:
A general bearish scenario can be seen on the daily and four hour time frames because the bitcoin price has broken the support levels of 11200.00, showing a bearish bias. The market is resting as now, and another bearish swing may be gearing up at the resistance levels of 11155.32.
Bitcoin BTC News Events
The Russian authorities are coming up with rules and guidelines concerning the crypto mining process within their region. This development has made miners in Russia purchase more mining equipment due to the uncertainty surrounding the regulations.
The effect of COVID-19 has led to an increase in the remote workspace as the sales in graphic cards are on the rise; likewise, there is a new level of rising in cryptocurrency mining.
The surge of interest in the Russian mining led to the Digital Financial Assets Law, which the legislators are planning to pass a new law by December 2020.
The Russia Authorities (Ministry of Finance) fills that there is a need to amend the previous law on the DFA, which allows miners to receive their rewards in cryptocurrencies. The authority’s views crypto mining that is standalone as the legal process only for it to lose its financial value.
Conclusion and Projection
The COVID-19 experience has affected the behaviors of Indian brokers, retail traders, investors, and instructional traders because of the total collapse of business around the globe.
We are likely to see the bullish surge reduce in momentum as the week progresses, and the value of bitcoin drops as traders and investors are set to pick their profits.

No Comments found