BTCUSD Weekly Outlook , December 12 2018
Bitcoin to USD – Technical Analysis & Weekly Forecast
Introduction
Bitcoin the number one digital currency by market capitalization has experienced a huge decline in value, following a series of regulatory adoption and increasing bearish sentiment on the technical charts. Read on as we update you on the recent happening in the cryptocurrency space.
Fundamentals
Regulatory Adoption
U.S Regulatory Bills
In the News this week, congressmen Ted Budd and Darren Soto of the United states passed two bills which can be found by following at This bill is aimed at protecting investors in virtual currencies as well as consumers who will be using these as a form of exchange.
Regulation of cryptocurrency in Malaysia
The Malaysian finance regulators and central bank on 6th December issued a joint press statement establishing a move to implement laws on cryptos and ICOs. Senior government official in the country hinted that regulation of the sector could take effect from the first quarter of 2019.
Monthly Chart of the BTC/USD

If you’ve been following our series of analysis, then the critical support levels established by the double bullish accumulation on July 2017 and the double bearish accumulation on October 2018 should be familiar to you as they are the most critical levels of the BTCUSD monthly chart.
As the price of Bitcoin plummets, we project it to use the 1852.02 support as a probable reversal target.
Review of Past and Upcoming Events in the Bitcoin Community
December 12 2018: Bakkt Launch
The Intercontinental Exchange, Bakkt will be having an official cryptocurrency platform launch on the 12th of December which has been pending regulatory approval. Cryptocurrency enthusiasts and investors will be on the lookout for patterns that may give clues towards a bullish recovery.
Upcoming Events
December 28 2018 – CME: December Last Trade
This event is a very important one as it happens to be the last event for the year. A formation of technical price pattern between the daily, weekly, and monthly time frame often hint on the direction of the first quarter of the new year 2019.
Daily Chart of the BTC/USD
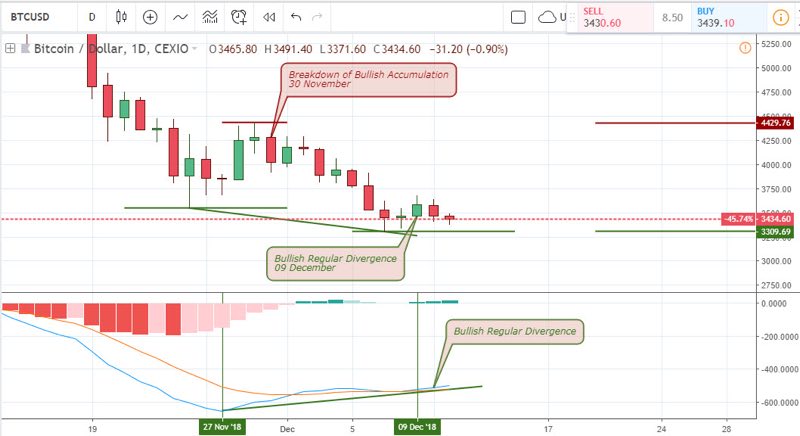
After a breakdown of bullish accumulation on 30 November, and a price drop of about 17.30% , the above daily chart of the BTCUSD illustrates how the pair enters into a bullish regular divergence pattern.
This pattern would have been considered highly probable if there was a technical price pattern that coincides with the divergence pattern. A breakdown below the divergence support at 3309.69 or a dead cross of the MACD oscillator should lead to a failure of the divergence pattern. On the flip side, a low risk exposure to this pattern might not be a bad idea.
2-HR Chart of the BTC/USD
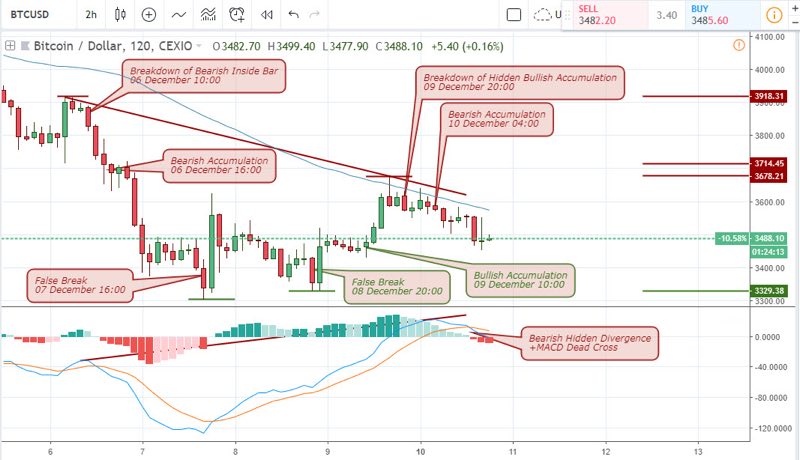
The above 2hour chart triggers a bearish hidden divergence pattern which was double checked by a dead cross of the MACD oscillator, as well as a breakdown of bullish inside bar on 09 December. The Bitcoin price from this point quickly entered into a bearish trend from this point, completing a 5.2% decline at the moment of putting this article together.
Conclusion and Projection
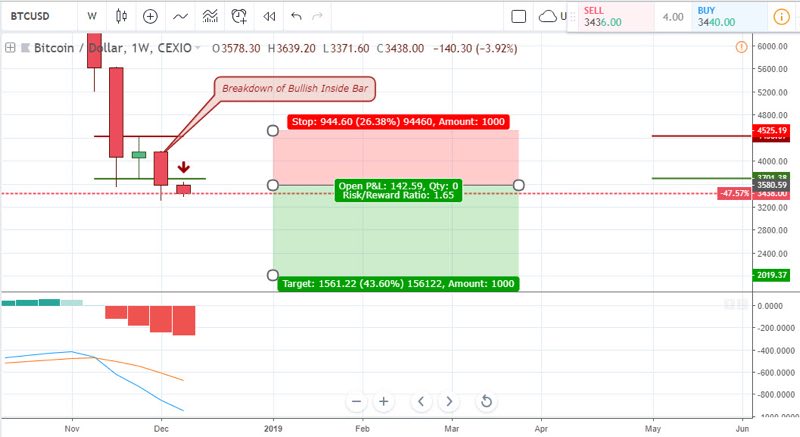
Last week, we spotted the bullish inside bar formed at the clsoing price of the 26 November. We pointed out that a bearish price close below the insidebar support will lead to a further drop in the exchange rate of the Bitcoin to USD.
The chart below shows a projected 43.60% price decline which translates to a 1.65 risk to reward ratio.
BTC/USD : Weekly
Top 3 Cryptocurrency Brokers to trade BTCUSD


No Comments found