EURUSD – Weekly Outlook & Analysis for 15th October 2020
EURUSD Forecast & Technical Analysis for Forex
Introduction
Looking at the OlympTrade platform, the EURUSD pair had not been trending as expected. Could it be due to the US election coming soon and recent coronavirus waves in the Eurozone?
Let us see what the chart has for us!
Fundamentals
Euro Zone
Trade Balance:
The forecast is 18.1B while the Previous was 20.3B
The European zones pay attention to the trade balance within the region, and the key players are Germany and France. The report check for the differences between the exported and imported goods and services for the month inventory was taken.
When the actual data shows a more significant outcome, it is suitable for the Euro, while a lower effect will mean a bearish move for the currency. Therefore, a positive Trade Balance indicates that more goods and services were exported than imported.
U.S.
Retail Sales m/m:
The forecast is 0.7% while the previous 0.6%.
The Census Bureau is responsible for releasing the retail sales report, which is done on the 13th day of the new month. The report shows the total value of sales and the changes at the retail levels.
If the data is greater than the forecast, it is suitable for the US dollar, while a lower data than the forecast will mean a bearish move for the currency.
EURUSD Technical Analysis
EUR vs. USD Bigger Picture: Upward Trend
Monthly Chart

Monthly Resistance: 1.25558, 1.21545, 1.18523, 1.15698
Monthly Support: 1.10292, 1.08288,106359
The EUR/USD pair still has the bullish trend momentum, which started from the 1.08288 levels, taking a break last month with a bearish close. We need to see the price close above the resistance zone of 1.21545 for another bullish swing towards the 1.25558 resistance level as a continuation of the trend.
If the 1.18523 levels of resistance should hold, we may see the bears take over the forex platform from the zone with a possible push to the 1.15698 levels.
Weekly Chart Bullish

Weekly Resistances: 1.19207, 1.20114, 1.14222
Weekly Supports: 1.12430, 1.14963, 1.16959
The US dollar showed signs of strength at the resistance zone of 1.19207 and 1.20114 some weeks ago before the retest of the bulls’ levels. The bears must hold the psychological level and reject the Bulls push to close below the 1.16959 level for a reversal of the trend.
However, the EUR/USD uptrend is still active because there is no confirmed reversal pattern on the time frame yet; therefore, we need the bull run to close above the 31st August 2020 resistance level (1.20114) to see a continuation of the uptrend.
EURUSD Mid-Term Projections: Bullish Triangle
Daily

Daily Resistance: 1.20111, 1.19163
Daily Support: 1.1696, 1.16122
The daily time frame has been ranging for a while, having seen that the EUR/USD pair had not closed and gone beyond the support (1.1622) or resistance (1.19163) levels.
From the support level of 1.16122, the bulls were able to push back the price towards the resistance level of 1.19163 after the bears closed below the 1.16960 levels. This move shows that both the Bulls and Bears are active at these levels.
If the bulls rally must continue, they need to overcome the various resistance levels for a continuation of the trend. If the bears must control the market, they need to use the resistance levels as a springboard to reverse the trend in their favor.
H4
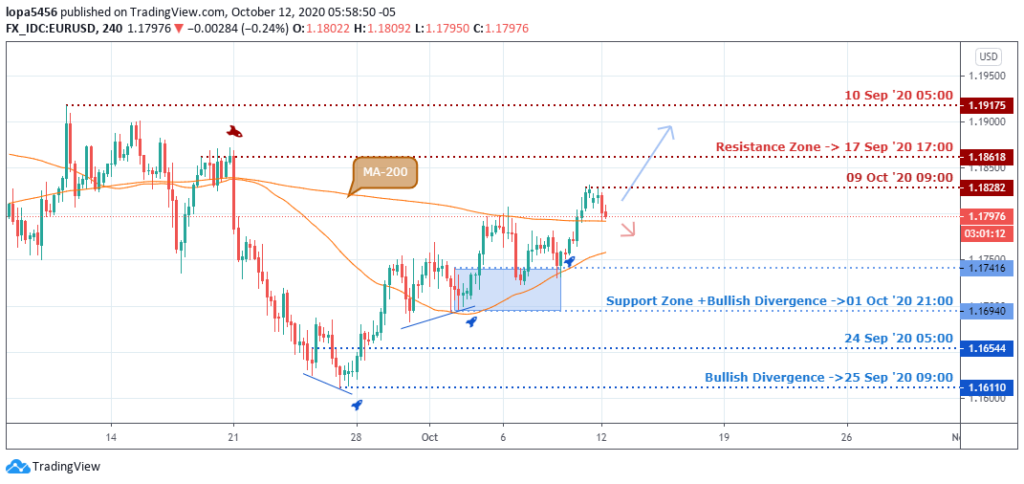
H4 Resistance: 1.18282, 1.19175
H4 Support: 1.16544, 1.16110, 1.16940
The US dollar gain strength against the Euro from the resistance zone of 17th September 2020 (1.18618) that led to a downward swing reaching the 1.16110 price levels. Presently, you can see that price is within the previous zone, which may act as a resistance against the bulls run and likely push the price back to the 1.16940 level of support.
The bullish rally from the 1.16110 support may push above the 1.18282 level if the 200 moving average can act as dynamic support for the price as we wait for the price reaction around that area.
Bearish Scenario:
A bearish scenario may play out based on the H4 time frame if they can reject the bulls’ advancement from the resistance levels of 1.18282, 1.19175, which had earlier pushed down the price of the major pair.
Bullish Scenario:
The bullish scenario is still in place based on the weekly time frame, as the chart has not shown any reversal pattern. However, the uptrend will continue when we can get a close above the 1.19207and 1.20114 resistance levels.
Conclusion and Weekly Price Objectives
The forex platform may not have much volatility due to the US presidential election coming up in a few weeks. Traders and investors would want to know the outcome of the election because a new administrator would mean new policies that will influence the currency market.

No Comments found