USD/INR – Weekly Outlook for September 6 2019
USDINR Forecast & Technical Analysis
Introduction
The USDINR has been experiencing a steady increase in exchange rate across FBS platform for eight weeks in a row following a series of bearish fundamental data towards the Rupee against a strong Greenback.
India’s Fundamentals
India Infrastructure Output
The infrastructure sector of the Indian economy accounts for 26.68% of the county’s industrial output.
A higher than expected value should be considered positive or bullish sentiment for the INR, while a lower than expected value should be regarded as negative or bearish for the INR.
Data released recently shows the previous reading to be 4.3% while the actual reading is 0.2% signaling a bearish outlook for the INR.
U.S. Services Purchasing Managers Index (PMI)
The Service PMI release, which is published every month by Markit Economics, is based on studies of more than 400 executives in private sector service organizations. The surveys comprise data from the hotels and restaurants, transport and communication sectors, business and personal services, financial intermediaries, computing, and IT establishments.
An index level of 50 means no change was recorded since the previous month, while an index level beyond the 50 mark signals an improvement, meaning that reading under 50 indicates a deterioration.
A reading stronger than forecast is ordinarily regarded as supportive (that is bullish) for the USD, while a reading weaker than forecast is generally considered negative (that is bearish) for the USD.
Most recent data released on August 22 shows that actual reading is 50.9 while the previous reading was recorded to be 53.0. The forecast reading was shown to be 52.9, signaling a bearish outlook for the USD.
USDINR Technical Analysis
USDINR Long term Projection: Bullish Swing
USDINR: Weekly Chart

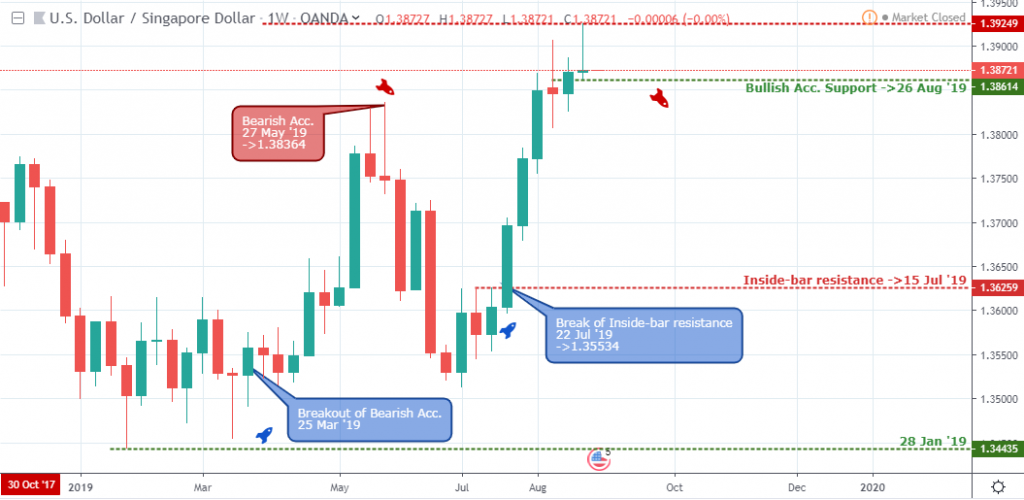
Above is a weekly chart illustration of consecutive bullish closing bars. Starting with a bullish engulfing candlestick pattern on July 29 ’19, the USD to INR exchange rate surged higher by about 3.8%, then closed bearish last week forming a bull trap formation.
At the opening of the week, the price rally towards last weeks’ high, an indication of the bullish presence and probable price rally. The bullish accumulation support at 70.726 is a major pivot for the current price rally seen on the USDINR chart. A failure of this level will stress an increase in selling power.
USDINR Medium Term Projections: Overbought
USDINR Daily Chart

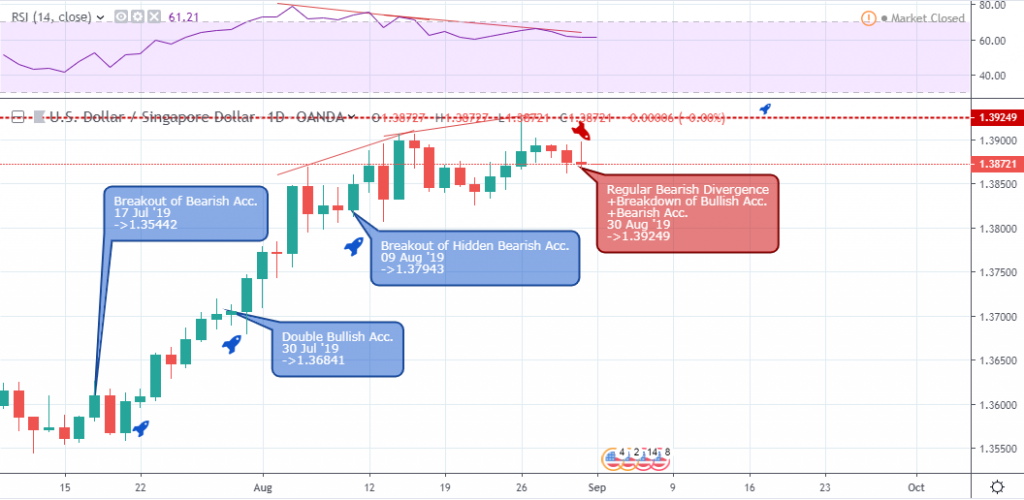
A view from the daily time frame reveals a low time span regular bullish divergence pattern that set the ball rolling for a bullish trend. The divergence pattern offered a low risk (approximate 0.65%) buy signal for a reward of about 5.5% at a reward/risk ratio of about 8.5.
While the price chart forms new highs at publication time, the Relative Strength Index forms lower highs, a sign of highly probable price reversal from a regular bearish divergence pattern.
The bear trap on August 28 ’19 shoots the price back up at September open. If the price fails to close above the 72.332 bearish divergence resistance level, then, a downward trend is still possible; otherwise, we should gear up for a price hike.
USDINR 4HR Chart

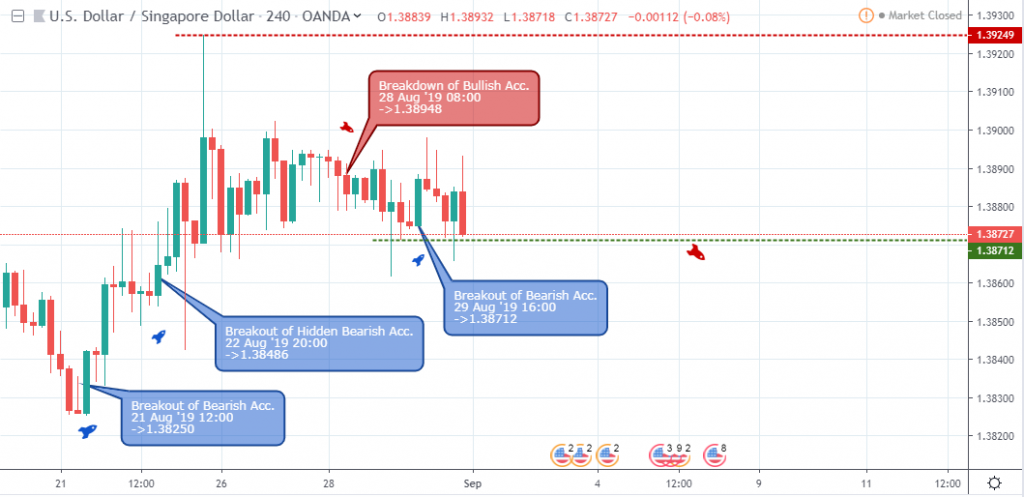
Lastly, from the 4hour time frame, the bulls again dominate bearish resistance on August 07 and 15. The bullish trend from the 4hour overview started with a breakout of bearish accumulation on July 30 04:00, presenting re-entry setups on August 02, 13 and 21.
After the sudden rise in buying power at the weeks open, the USINR enters the overbought area and threaten to break below 72.218 support, at the same time exiting the overbought territory on September 03 ’19 08:00.
Conclusion and Projection
The bearish buildup as an exit of the overbought area (4hour time frame) at publication time may suffice for reversal of the bullish trend. On a general note, the Indian Rupee is in a strong bearish trend from the long term time horizons. Short term sell orders can be taken though, considering the pair is overbought on the higher time frames.

No Comments found