BTCUSD Weekly Outlook and Bitcoin Fundamentals , 7th October 2020
BTCUSD Forecast and Technical Analysis & Fundamentals for Bitcoin
Introduction
Could the upcoming USA Presidential election be the reason for a quiet and stable bitcoin as investors are concerned about the person who is likely to drive the seat of power in the next four years of administration?
The COVID-19 case of American President Donald Trump is another twist for BTCUSD traders as Indian brokers and institutional traders hold bitcoin as a haven.
BTCUSD: Technical Analysis
Monthly Chart

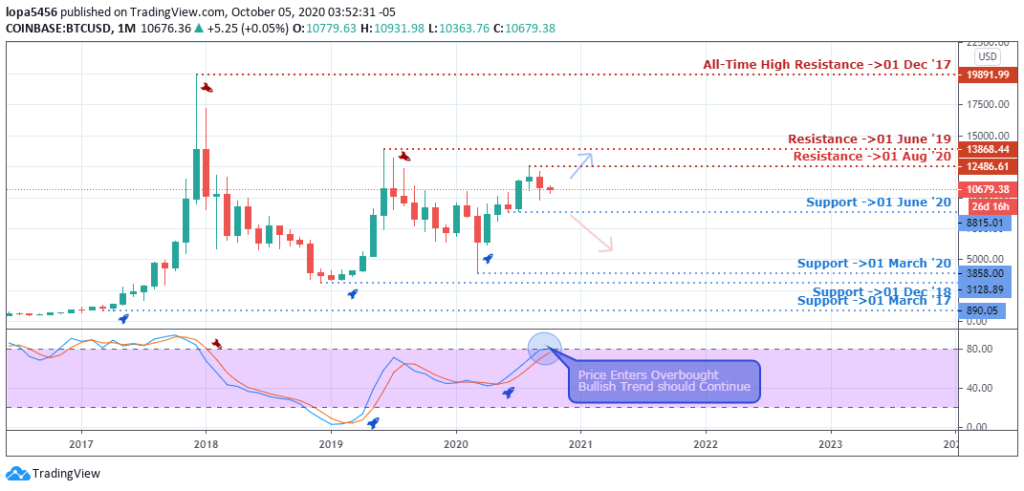
Monthly Resistance Levels: 12486.61, 13868.44, 19891.99
Monthly Support Levels: 3128.89, 3658.00, 8815.01
The bitcoin high of June 2019 has been a strong resistance against the bullish rally that took the price up from the support zone of March 2020 at 3858.00. If the bullish trend must continue, bitcoin’s price must close above the resistance levels of 13868.44 and 12486.61 to reach the all-time high of bitcoin.
The Indian brokers will observe the reaction of bitcoin price within the resistance levels to see if the bears will turn the zone to their advantage for a bearish swing down to 8815.01.
The signal line of the overbought indicator will confirm the downtrend or mean a continuation of the bullish trend.
Weekly Chart

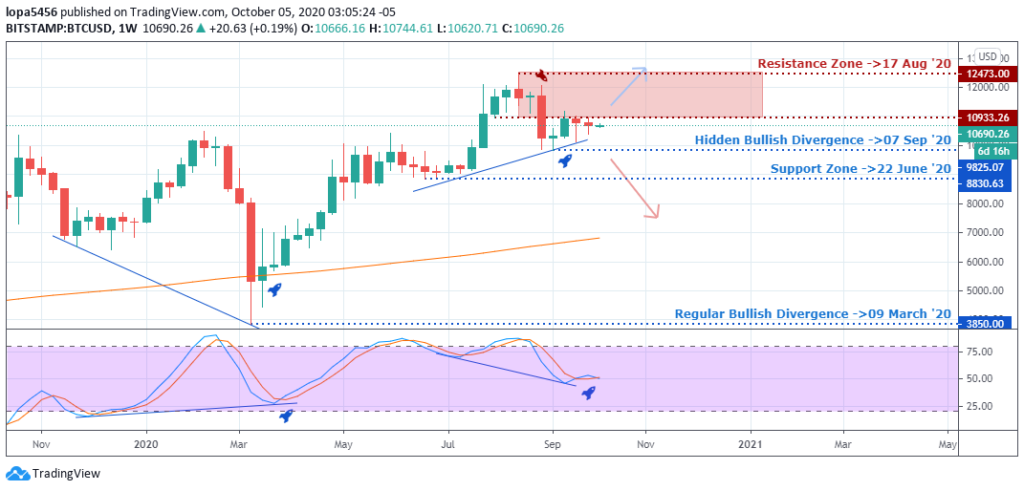
Weekly Resistance Levels: 10933.26, 12473.00
Weekly Support Levels: 3850.00, 8830.63,
As the new week unfolds, we expect the bears to react to the bull’s advancements towards the resistance levels, holding the zones about three weeks before the bearish weekly candle close. If the bears can grow in momentum, we shall see bitcoin drop in price.
However, in my opinion, these moves can be an early sign investors are picking their profits for the year-end ahead of the USA election.
Should the bulls overpower the bears around the resistance levels of 10933.26 and 12473.00, this will mean that bitcoin value for the year may still rise unless the Bears can reject any bullish advancement in the weeks to come?
Daily Chart

Daily Resistance Levels: 11771.44, 12473.00
BTCUSD Daily Support Levels: 8830.63, 10380.00, 10667.53, 9825.07
The daily time frame is technically forming a symmetric triangle, and price can breakout to either side of the triangle. A flight below the 10667.53 will mean a bearish push to the 9825.07 levels and possibly lower.
Suppose the breakout is above 10669.32 resistance zones. In that case, we will see a retest of the 11771.44 resistance for another bearish rejection from the zone or a successful bullish breakthrough of the resistance levels.
H4 Chart

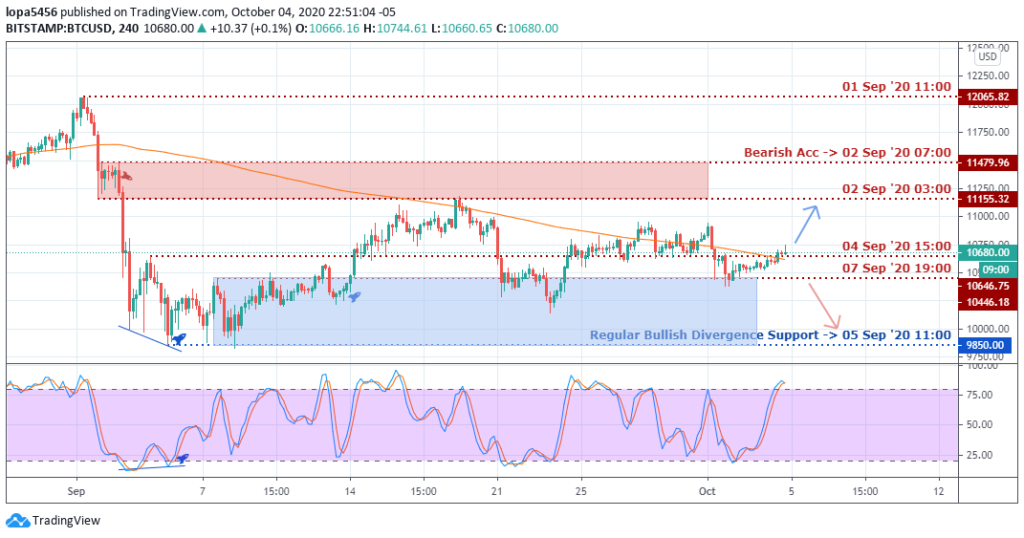
H4 Resistance Levels: 11479.96, 11155.32, 12065.82
H4 Support Levels: 10646.75, 9850.00
After the price of bitcoin dropped from the high of 12065.82 as of September 2020 down to 9850.00 levels, you can see bitcoin hovering between 9850.00 and resistance levels of 11155.32, waiting for a deceive action in a particular direction.
The H4 chart shows the current price rise forming a bearish pennant before a breakout if all things been equal.
Bullish Scenario:
A possible bullish scenario could come into play based on the daily time frame because of rising supports. The lows are getting higher, a buildup of bullish momentum for an upward surge towards the previous resistance (11771.44).
Bearish Scenario:
A general bearish scenario is seen based on the weekly time frame as we await the retest of the resistance to see if it holds or not.
There are higher chances that the Bears pressure is building up gradually for a reversal of trend if the weekly resistance (12473.00) is not breached.
Bitcoin BTC News Events
The downward reaction of bitcoin price came due to the charges levied against a top exchanger of bitcoin (BitMEX) for its fraudulent act by CTFC after it was revealed that an asset worth $150 million had been stolen.
The bitcoin price was about to collapse when news of the USA president contacting COVID-19 was announced on the trading floor; it was a boost for the bitcoin because of the fear of a weak dollar as investors looked for a haven for investments. Some traders believe that the bullish trend will continue soon, having survived an eventful week.
However, the bitcoin needs to break out from the multiple levels of resistance daily and weekly time frames to have full control.
However, the loss of bearish momentum after the legal suite is what many traders and institutions are watching. Such events naturally would have led to a bitcoin price collapse; maybe the effect will ripple later in the month.
Conclusion and Projection
The bitcoin price is within a range, and a breakout can be either up or down. Indian brokers, along with other traders, are watching the bitcoin market structure for confirmation of the trend.
Some traders opened long positions from the 10380.00 level anticipating another swing high, while the sellers from the 12473.00 are holding in anticipation for another bearish surge to takeout the 10380.00 levels.
As events unfold, the actual direction will be known to all traders and investors.

No Comments found