Bitcoin to USD ( BTCUSD ) Forecast & Weekly Analysis, August 18 2018
Bitcoin to USD Weekly Forecast & Analysis for Indian Brokers
Introduction
The previous week raised the hopes of cryptocurrency enthusiasts, as the pair broke out of a technical trend line resistance. All hopes were lost for HODLers when the pair broke a bullish accumulation support from the daily chart perspective. Read on as we explore the technical and fundamental dynamics of the BTC to USD exchange rate.
Regulatory Adoption
In a bid to warn British investors, the FCA warned that crypto investment scams are on the increase in the UK, as perpetrators use prestigious London Addresses as smokescreen. This warning was published on August 17 as the authorities warn on how scam firms may manipulate software to alter prices, as well as deceiving people into buying non-existing tokens. The FCA emphasized that cryptocurrencies themselves are not regulated by the agency at the moment. This means that a lot of crypto brokers do not comply with the FCA authorization, and investors should therefore desist from such brokers/exchanges. On the other hand, the agency affirmed that they do regulate crypto derivatives such as Futures, CFDs, and Options
Blockchain Adoption
China is quickly becoming an early adopter of blockchain technology in programs signed by the president, and generally national programs. Most recent is the use of the technology to combat fake invoices targeted at embezzling corporate and state funds. In the city of Shenzhen and a state’s aerospace firm, the blockchain is deployed for bringing an end to paper corruption via its immutability and transparent record-keeping.
Technical Analysis
We’ll be going about the technical analysis using a multiple time-frame approach. It offers a bird’s eye view, as well as a microscopic view of the time series data.
BTCUSD: Monthly Chart

The pair still maintains a strong bearish outlook from the monthly time-frame. A price close below the $6171.49 support level signals further bearish movement. The bearish accumulation pattern formed in March indicates a huge selling pressure; hence the support level will not stand the test of time.
BTCUSD: Weekly Chart
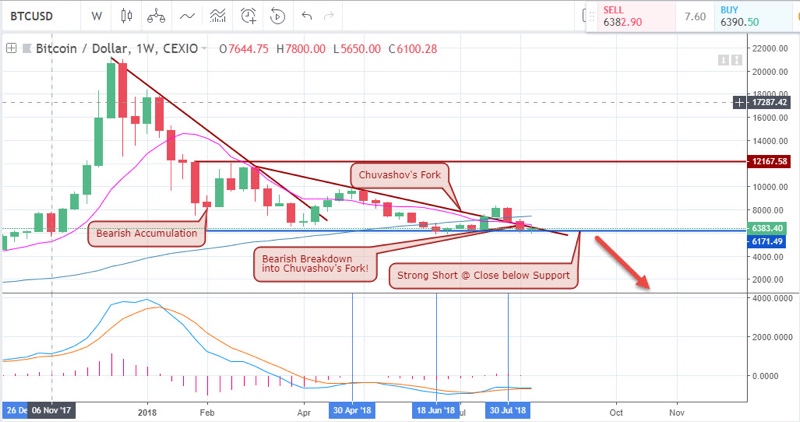
The Chuvashov’s fork is the most significant price pattern that showed prospects of a bullish recovery of the Bitcoin to USD pair. However, the pair did another candle close back into the trend line, forming somewhat a trend line overbought setup.
BTCUSD: Daily Chart
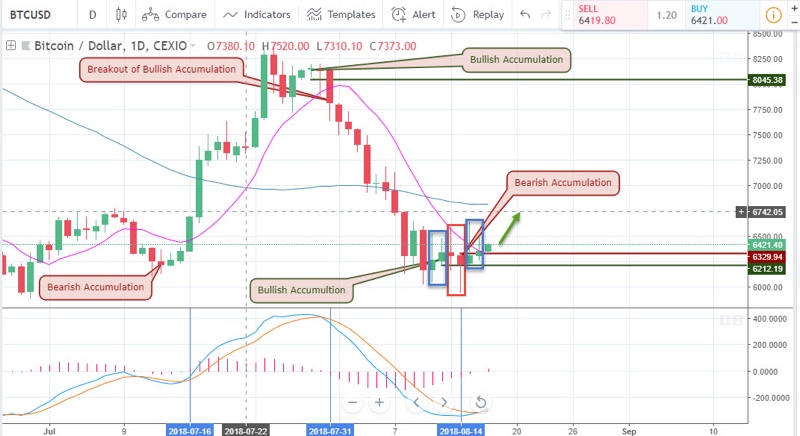
All hopes of the BTCUSD pair recovering from the long bearish trend were dashed on 31st July 2018 when price broke out of a bullish accumulation phase. Price on the daily time-frame continued with a series of consecutive bearish candles, up till 14-07-2018 where the pair entered into a bullish and another bearish accumulation zone. From this point on, price trades in a range with hopes of breaking out into another bullish trend.
BTCUSD: 4-hour Chart
From the 4-hour time frame, accumulation phase translates into a series of alternating bullish and bearish divergence patterns, with the bullish pattern currently at play. At the base of each divergence setup are both bearish and bullish accumulation patterns that put the pair in an oscillatory motion. Price now trades between the $6590 and $5938 resistance and support levels.
BTCUSD: 2-hour Chart
The 2-hourly chart above shows one part of the price series, after completing a bearish swing. The bearish swing base was clustered with both bullish and bearish accumulation breakout.
Conclusion and Projection
This week has been a rollercoaster with both bullish and bearish swings in place.However, with the weekly chart closing back into the second trend line of the Chuvashov’s fork, chances are that we are resuming the long bearish trend of the monthly chart. Moving forward into the next week price could approach the $5000.00 zone.
Top 3 Crypto Brokers to trade Bitcoin to USD


No Comments found