Bitcoin to USD ( BTCUSD ) Forecast & Weekly Analysis, September 19 2018
Bitcoin to USD Weekly Forecast & Analysis for Bitcoin Brokers
Introduction
The pair BTCUSD went bearish in the early days, as projected in our last article. We even pointed out the overwhelming bearish outlook of the monthly and weekly timeframes. Well as the week unfolds, new twist and turns are showing up in the cryptocurrency markets which now offer short-term intra-day trading opportunities.
Fundamentals
Regulatory Adoption
Taking a look at the regulatory adoption of cryptocurrencies in Central Asia, in the spotlight this week will be Uzbekistan and Kazakhstan.
Starting with Uzbekistan, the nation has shown a positive outlook towards bitcoin brokers and exchanges, as well as mining. A law was signed into law by the country’s president Shavkat Mirziyoyev, which was enforced in 2nd of September. In the law, a minimum capital of about $710,000 is required to register a crypto broker/exchange.
On the contrary, in Kyrgyzstan, cryptocurrencies are banned since July 2014. This was based on a warning statement issued by the National Bank of Kyrgyz Republic, labelling Bitcoin and other altcoins illegal.
Blockchain Adoption
According to a blockchain Enterprise Survey by popular fintech analysts Juniper House, blockchain adoption by large enterprises made a rise of about 11% this year. Based on analysed data, a quarter of firms have moved to a commercial roll-out of blockchain-based applications, mostly payment related. Major areas of interest have been Authentication, Smart Contracts and Logistics.
The president of Uzbekistan has also established a state blockchain development fund which was titled “The Digital Trust” based on a publication on the government’s official website. The integration of blockchain into government projects such as education, healthcare to mention a few are major goals of the fund.
Technical Analysis
Still deploying multiple timeframe approaches to analysing the pair, the trend is obviously bearish on the monthly and weekly charts, but the lower time frames offer more of swing trading opportunities. Read on for more insights.
BTCUSD: Monthly Chart

Lets’ do a little time travel to the month of January 2017. A bullish accumulation pattern was fired which caused the price to move upwards. The month of July for in the same year this time around triggered a double bullish accumulation pattern which offered more confidence for traders and bitcoin brokers /exchanges alike. Fast forward a bit to March 2018, and we see a similar pattern, the only difference this time is that it’s a double bearish accumulation pattern signaling huge bearish pressure.
BTCUSD: Weekly Chart
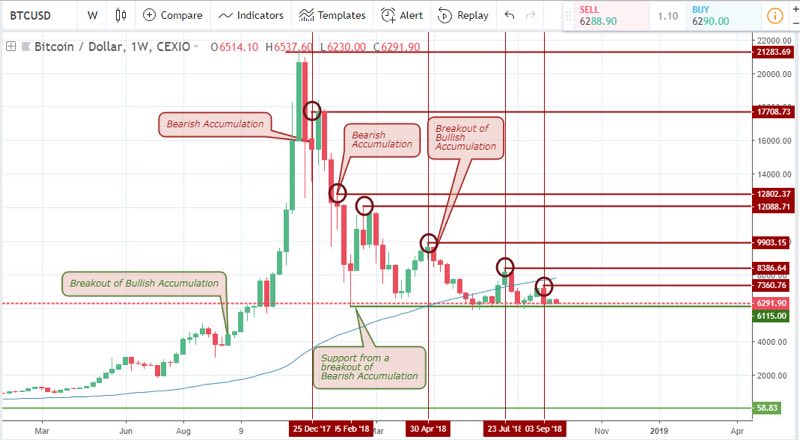
Following the path of the monthly chart, our weekly analysis of the pair which we believe is where serious long-term traders and crypto brokers pay attention to, as it clearly shows the pair making successive lower highs. A breakdown towards the $4000.00 mark is highly probable.
BTCUSD: Daily Chart
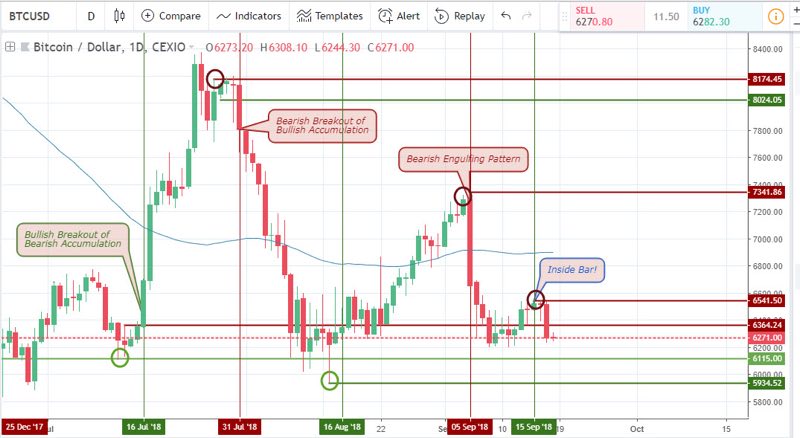
The chart above is often a favorite for swing traders, as bearish and bullish accumulation price action patterns offer trading triggers via bullish and bearish breakouts on the 16th July, 31st;16th August, and the awkward surprise bearish engulfing pattern on September 5. If you read our last review on the BTC to USD pair, you’ll realize that the bearish accumulation resistance we pointed out held price down, leading to an inside bar formation.
BTCUSD: 4-hour Chart
Looking at the above chart, we’ll notice that the previous week has been swinging from peaks to troughs with major supports at 6199.69, 6228.01and most recently the bearish accumulation support of 6231.13 which failed to a bullish breakout. A price close below the 6231.13 support nullifies this trade and it should be automatically closed in a loss.
BTCUSD: 2-hour Chart
From an intraday point of view, the 2-hourly chart of the BTCUSD pair shows a bearish accumulation breakout setup with possibilities of offering short-term profits today the 18th 06 pm. Price close below the support level at $6269.84 nullifies the signal and puts us up for another bearish run.
Taking a look back into our last post, you observe that our idea for a short trade paid off, as the pair later entered broke out of bullish accumulation patterns both on 17Sept 20 pm and 17Sept 04 pm. Expected target is the 65-period moving average.
Conclusion and Projection
Although we are of a very high bias that the pair is highly bearish in the longer term, before it happens, there will be a lot of rises and falls at the lower time frame which is prevalent amongst intraday players. That being said, the 2hr and 4hr charts should offer opportunities for quick profit-taking, while we look out for those unannounced bearish price drops to come. Happy trading friends!
Top 3 Bitcoin Brokers to trade Bitcoin to USD


No Comments found