USD to INR – Weekly Outlook ( September 26, 2018 )
Weekly Forecast for Indian Rupees
Introduction
India’s policymakers may attempt a rescue reactionary measure to control the current inflation of the Indian Rupees. A hike in interest rate is one that most India broker/analyst is on the lookout for. Read on as we take a dive into the fundamental and technical twist and turns of this week.
India’s Fundamentals
India 50 4hour Charts

This time around we consider a 4hourly chart perspective of the India 50. It’s obvious the chart is currently in a bearish trend, triggered by a bearish hidden divergence pattern on the 17th of September. Well at the moment, there are positive signs of recovery of India 50 as the chart triggers a breakout of a bearish accumulation pattern on Tuesday, September 25.
Tariff threats on the increase as China cancels trade Talks
Coming from a news report from the Wall street journal, China’s intention to send Vice-premier Liu He to Washington next week for upcoming trade talks with the United States has been cancelled. China has added U.S. products worth $60 billion to its imports tariff list as a form of retaliation against the U.S. duties.
India’s Interest Rates
According to a Reuters (Bengaluru) poll, the RBI (The Reserve Bank of India) may likely raise interest rates in October. This may lead to a strengthening of the Indian Rupees, should there be a higher than expected reading.
U.S dollar News
Following a hike in interest rate by the Federal Reserve, the dollar made a recovery from a dip, flagging an end to the accommodative monetary policy. According to Jamie Cox, the managing partner at Harris Financial Group, Richmond Virginia, The strong dollar has fueling everyone’s international investments for the about a year or so.
The Dow made a rise of about 0.16%, while the S$P 500 made a gain of about 0.27%, and the Nasdaq Composite made a 0.5% gain.
Technical Analysis
USDINR Monthly Chart
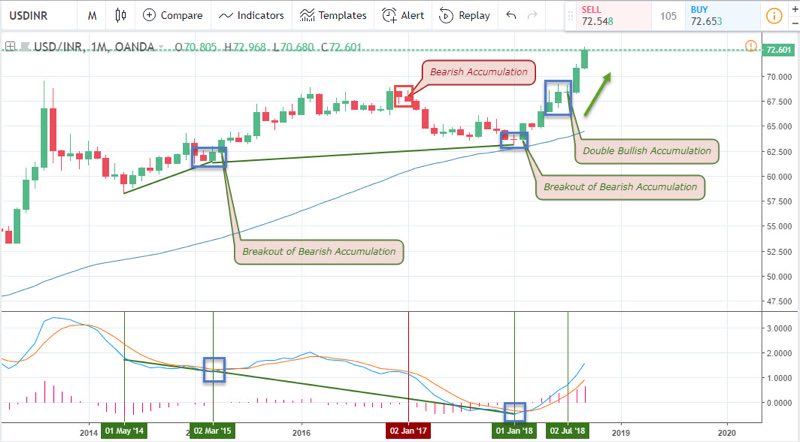
It is amazing how the monthly time frame of the USD to INR currency pair has continued to maintain a bullish outlook since the last time we analyzed it. The double bullish accumulation pattern that succeeded a combination of bearish accumulation breakout and a bullish hidden divergence pattern continue to fuel this rise.
USDINR Weekly Chart
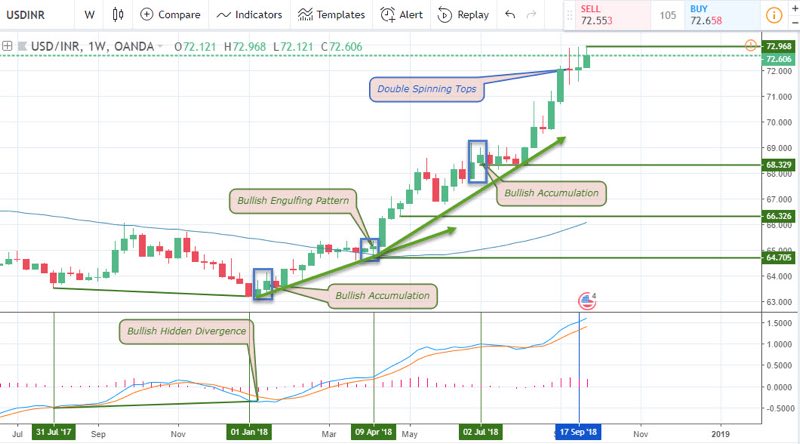
The last time we took a peek at this time frame, we tried to gauge a possible reversal level of the USDINR pair, zones where India brokers and traders alike may be looking out for profit taking opportunities. As a result, we deployed a Fibonacci extension, which proved to reflect the price action patterns in the form of spinning tops as shown on the chart above.
USDINR Daily Chart: Bullish Divergence
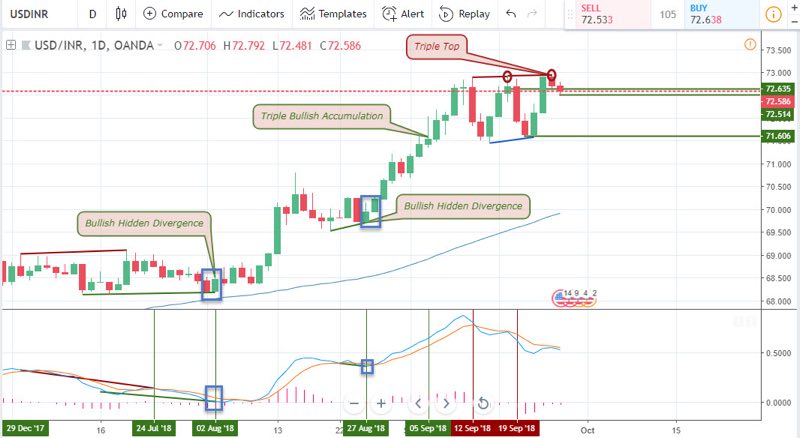
Between the 24th of July and 2nd of August, the pair oscillates within both bearish and bullish divergence patterns, the last of which was the bullish accumulation pattern which sends the exchange rate flying high in favour of the U.S dollar. Towards the end of August, on the 27th of August, the pair triggered another bullish hidden accumulation pattern which could not go unnoticed.
Most recently, on the 12th of September, a breakdown of bullish accumulation pattern was triggered, sending the pair into a correction of gains in U.S. dollars. The U.S dollar again attempted a recovery, of which it later failed to another breakdown of a bullish accumulation pattern on the 19th of September. At the moment the pair is currently signalling a triple top price action pattern as price makes another move towards the accumulation resistance highs.
4-Hour (H4) Time Frame
Here on the 4hour chart displayed above, we get a clearer look at the dynamics of the double top pattern mentioned on the daily chart. First was a bearish regular divergence pattern formed on the 12th of September, followed by a similar breakdown of bearish accumulation pattern on the 19th of the same month. Around the early hours of 21st of September, the pair triggered a bullish hidden divergence pattern and followed by another bullish accumulation pattern to reinforce the move. September 25th is where a breakdown of bearish accumulation pattern was triggered, leading to a dead cross of the MACD oscillator.
2-Hour Time Frame
The 2hour chart is the closest we get to when carrying out analysis of time series of any pair. As shown above, we’ll observe that this week showed strength in favour of the Indian Rupees which may be seen as a correction, depending on what time frame trend you are considering. However, at the moment of putting this article together, the pair on the above chart triggers a breakout of a bearish accumulation pattern with potentials for a short-term long-buying trade.
Projection and Conclusion
With more negative sentiments towards the Indian Rupees, and a positive outlook for the U.S dollar, this week may resume a bullish move on the shorter time horizon, on the other hand, if a high probability bearish reversal signal is triggered on the daily chart, the pair may make a deeper price correction moving forward. The level the trend is now is a great area to lock in some profit following the bullish divergence pattern on the weekly chart.
Top 3 India Forex Brokers to trade Indian Rupees.


No Comments found