Bitcoin to USD ( BTCUSD ) Forecast & Weekly Analysis, July 6 2018
Weekly Crypto Forecast & Analysis for BTCUSD

Over the weekend on several bitcoin brokers and exchanges that close on Fridays, the Bitcoin to USD pair gapped higher on Monday. This offered new hopes for bitcoin speculator and enthusiast hoping the pair would make a comeback from its current decline in previous weeks.
Fundamentals
Regulatory and Security Adoption
Bithumb which happens to be the largest exchange in South Korea and number 4 in the world by volume recently got hacked during a security update on 20th June. This lead to a loss of more than 30 million dollars in cryptocurrencies. Meanwhile, Italian exchange, Bitgrail has also been hacked for over a hundred and seventy million dollars and has been seized by the Italian government.
The BTC to USD exchange rate immediately responded to this news and contributed to the decline in price.
Bitcoin: Number of Transactions waiting to be confirmed
From 3rd of February into this week, the number of transactions waiting to be confirmed on the Bitcoin network ranges below 25000 transactions. Compared to last year where the number of transactions went above 175,000 transactions. This could signal one of two things. One, a decline in speculative demand and miners’ transaction fees may be a reason for this experienced decrease in a number of transactions. A second reason may be that the introduction of the lightning network may have resulted in the reduction of the number of transactions waiting to be confirmed.
Only time will tell if this number of pending transactions will remain within the range in the above chart, as the exchange rate of BTC to USD rises.
Technical Analysis
As the previous month came to a close, we highlighted the difference between Hodlers and swing traders, where hodlers were likened to buy and hold investors. Assume the time series chart is Google earth, if you were going to navigate to your destination, your first point of reference would be the earth’s Globe. From this analogy, we’ll, therefore, start this week’s analysis by looking at the monthly charts, then scroll down to the subsequent time horizons for a clearer picture.
BTCUSD: Monthly Chart
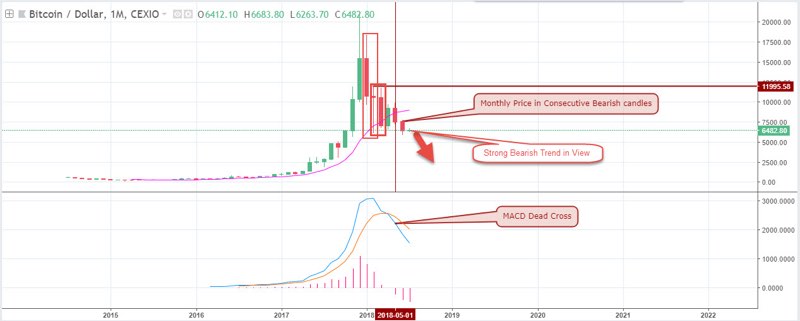
With the month of June closing bearish, this signals negative sentiment for the cryptocurrency giant, culminating into a huge bloodbath for traders holding on to Bitcoin at high prices. Following huge selling pressure formed within the previous 4th to 6th months, this signals a continuation of consecutive candlesticks on the monthly time frame, consequently leading to a bearish trend on the weekly, daily and 4-hour charts.
BTCUSD: Weekly Chart
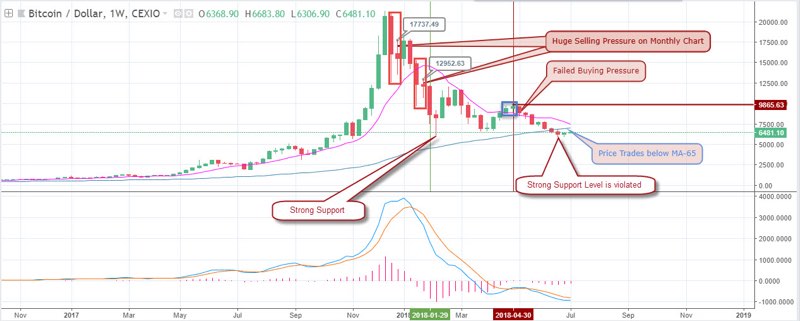
The above weekly chart continues to reflect our view of the monthly time frame. Although last week closed with a bullish candle, the overall sentiment of the pair is bearish based on the following reasons: –
The pair on a weekly chart closed below a strong Support level of $5925.00 signaling dominance of the bears. A failure of weekly bullish hidden divergence, followed by price close below the 65 periods moving average.
Bitcoin to USD: Daily Chart
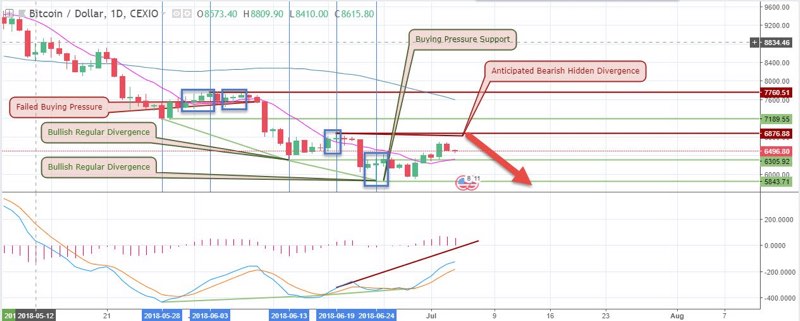
Bullish regular divergence patterns formed on the daily chart gives a faint hope of price recovery of Bitcoin price on the 13th of June and 24th of June. This gives us a better view of the possible patterns the pair can move into. I tag it faint hope because the bullish divergence on the 13th failed to sell pressure that ensued after the divergence pattern. The most recent divergence pattern on the 24th of last month had the better hope of pushing the exchange rate towards the MA-65 of the daily chart.
If the price does not close above $6876.00, the anticipated bearish hidden divergence shown on the chart will be triggered, considering we are only looking for buy only setups in a crashing market.
BTCUSD: 4-hour Chart
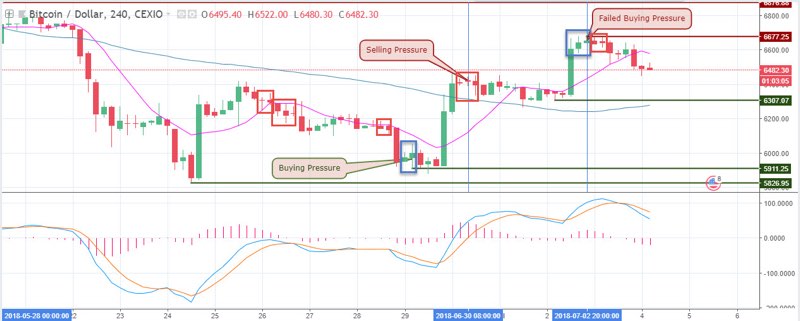
After a roller coaster path on the 4-hourly chart, the pair finally closes above the MA-65 of the above chart and using as a springboard support for a really short-term uptrend. The failure of a double buying pressure on the second of the new month has potentials of sending the price crashing down.
Conclusion and Projection
Although temporary signs of recovery in the exchange rate seem to be forming, we are of the opinion of not taking buy positions in a bearish market from a monthly and weekly time horizon. However, a failure of selling pressure on lower time frames such as daily and 4-hour charts may offer short time scalping opportunities. Only sell peaks in a down market and buy valleys in an upmarket.
Top 3 Brokers to trade Bitcoin to USD


No Comments found