BTCUSD Weekly Outlook and Bitcoin Fundamentals , June 30 2020
BTCUSD Forecast and Technical Analysis & Fundamentals for Bitcoin
Introduction
The Indian brokers and traders are concerned about the tension between the American and Chinese miners as the hash power is migrating from the east to the west among the mining firms.
BTCUSD: Technical Analysis
Monthly Chart
Monthly Resistance Levels: 19764.58, 17351.48,
Monthly Support Levels: 0.03, 0.16, 2.01, 3.40, 262.94, 4286.84
The Monthly time frame has completed the Eliot wave count cycle, and we may see Bitcoin in another phase of the cycle soon.
For months the BTCUSD has been on a long, robust trend since 2011 when Bitcoin started as low as 0.03. After every support was formed, bitcoin surge higher above the precede resistance.
The 197664.58 zone of 01 December 2017 was the last high or highest level bitcoin had ever risen to before it plunged to establish another support zone at 9242.23.
Bitcoin is a safe-haven for some investors and traders as they fear another wave of the pandemic might lead to another possible lockdown if the number of new cases is on the increase.
Weekly Chart

Weekly Resistance Levels: 10429.26, 9135.68
Weekly Support Levels: 3550.00, 4435.89, 7469.00, 86630.00, 91135.68
The resistance zone of 104429.26 on the weekly time frame shows that the bitcoin price respects the market level of that zone.
Weeks before now, the price has previously tested that zone before another retest of the area this current week.
If the price of BTCUSD is established on the support of 25 May 2020, we may see a price bounce off from the 9125.68 level, which will expose the overhead resistance.
However, if the support zone of 9125.68 should give way to bearish accumulation build-up, we may see price falling to the 8630.00 support zone in the coming weeks.
Daily Chart

Daily Resistance Levels: 9966.12, 9451.30
Daily Support Levels: 3350.00, 4435.89, 5753.04, 6923.17
After series of successive higher lows and highs, the Bulls were in control during the bullish run from 13th March 2020 till 18th May 2020. The bulls failed to go higher than the established resistance, a sign of a weak momentum in the past days.
The market is consolidating presently, and this may likely bring the bears into the market in the coming days if bitcoin fails to go higher.
The resistance zone of 18th May 2020 (9966.12) has been a strong zone for the bulls to close over for days; it must be a strong psychological zone in the BTCUSD market.
H4 Chart
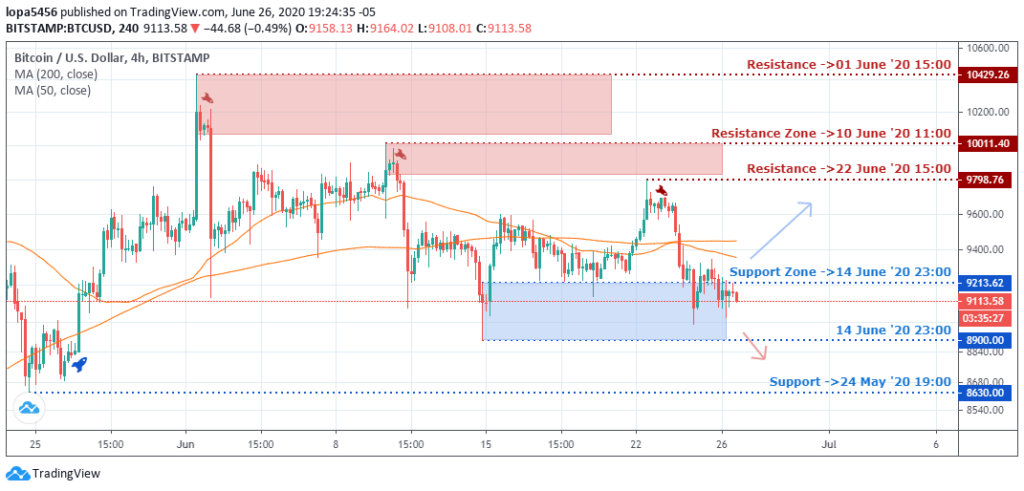
H4 Resistance Levels: 10429.26, 10011.40, 97668.76
H4 Support Levels: 8623.00, 8702.00, 9212.62
The BTCUSD upward movement of 24th May 2020 was the most definite move of price to the upside in the past hours times before the resistance became a secure zone rejecting any upward movement of price.
In recent times on 4 hours, we have seen the strong bearish reaction of bitcoin around the 10429.26 zones and 10011.40 levels, respectively.
We have seen that the price range of BTCUSD is between 92113.2 to 8200.00 and resistance levels of 9798.76. Indian brokers expect trading to be within the range until we have a definite direction.
Bullish Scenario:
Generally, BTCUSD has been in a bullish trend on the daily timeframe and above. In this scenario, we expect the trend to continue based on the higher time frames after the bitcoin price closes above the resistance zones.
Bearish Scenario:
Based on the H4 time frame, we may see an early reversal pattern for Bitcoin’s price to sell. However, bitcoin’s price needs to close lower than the 8623.00 support level for us to have a full downtrend bias.
Bitcoin BTC News Events
According to the CEO of Ripple SBI Asia, he predicted that the hash rate migration process has begun with huge interest from wealthy Chinese miners paying miners an average of $0.03 to $0.05 per kilowatt-hour while in Texas $0.025 and below.
The Trump tariffs targeting China has slowed down the migration process a bit. As soon as things get on the way, we will continue to see a better method.
However, the trade war is not over despite the COVID-19 pandemic crisis, which crippled the global economy.
Conclusion and Projection
The market is uncertain on the H4 chart, and it is a ranging market on the daily time frame. However, if the direction is unsure for Indian brokers, they should wait for a definite direction of bitcoin.

No Comments found