USDINR – Weekly Outlook & Analysis for March 5 2019
USDINR Forecast & Technical Analysis
Introduction
Last week, an increase in buying power as revealed on IQ Option India platform forced the USDINR out of the prolonged sideways market and flowing into a bullish trend.
The recent surge in the exchange rate allows traders to buy into dips from an intraday perspective.
Read on as we reveal some interesting news events and technical levels that support the current bullish upbeat.
India’s Fundamentals
India Trade Balance
The Trade Balance of a nation is an evaluation of the variation in value amidst exported and imported goods and services across a set time.
A positive figure shows that more goods and services were exported than imported.
A lower than expected data reading is considered a bearish move for the currency, whereas a higher than expected reading is seen as a positive move for the currency.
Traders can anticipate a bullish sentiment for the Rupee as the most recent data released February 14 shows that the actual reading is -15.17B, while the previous reading is -11.25B, and the forecast reading is 11.58B.
U.S. Crude Oil Inventories
The Crude oil inventory of the Energy Information Administration’s (EIA) is a weekly evaluation of the change in the number of commercial crude oil barrels held by firms in the United States within the week.
A drop in the inventories reveals a weaker demand for crude products. This implies a negative sentiment for the currency. When the decline in inventories is less than expected, it also shows a negative trend.
Growth in crude inventories signifies a higher demand for oil products, which implies a positive bias for the Dollar. This also applies if the drop in the inventories is higher than anticipated. A lower than anticipated data reading is considered a bearish move for the USD, whereas a higher than expected reading is seen as a positive move for the money. Traders can anticipate a bullish sentiment for the USD as the most recent data released February 26 shows that the actual reading is 0.452M, while the previous reading is 0.414M, and the forecast reading is 2.005M.
USDINR Technical Analysis
USDINR Long term Projection: Bullish
Monthly Chart

The long-anticipated bullish breakout of the USDINR is here, following a buildup of buying power as revealed from the January and February price close.
A continuation of bullish rally sees the pair inch towards the 74.528 resistance established on 01 Oct 2018.
The pair is clearly in bullish trend-setting support at 63.160, and 68.123. A close beyond the 74.528 should confirm new highs in the second quarter.
Weekly Chart

From a weekly time frame, the USD to INR exchange rate breaks out of the tight 11 Nov 2019 and 23 Sep 2019 resistance last week, 24 Feb 2020, as projected in our previous post.
A slowing of the bullish thrust is anticipated after the pair enters the 74.528 resistance set on 08 Oct 2018. It should be a good level to take some profit off the table.
USDINR Medium Term Projections: Bullish Breakout
Daily Chart

A view from the daily time frame shows the USDINR setting higher lows, after a series of price close above bearish resistance levels on 15 Feb Jan 2020, 12 Feb 2020, and 26 Feb 2020.
The price breakout above the 26 Feb 2020 resistance was followed by an accumulation of buy order on 28 Feb 2020 and continued for three more days in a row.
4HR Chart
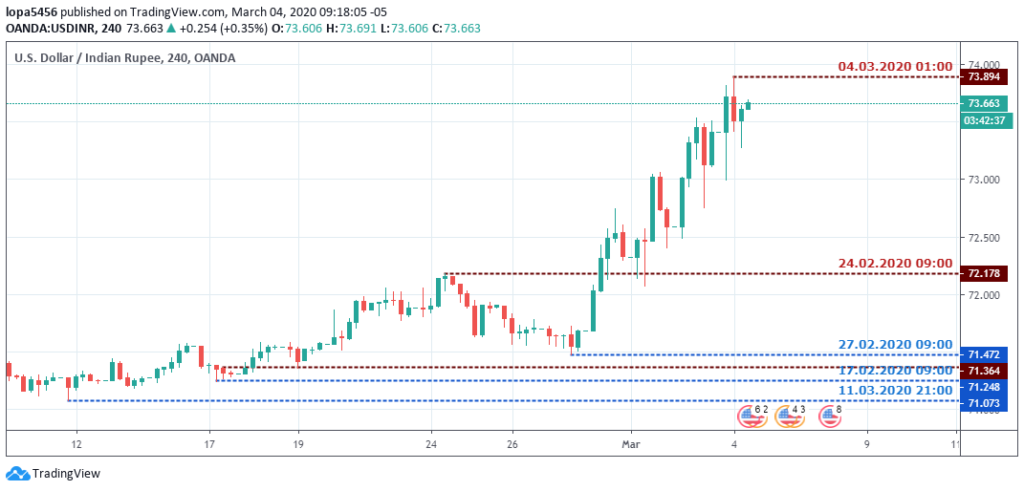
Zooming down to the 4hour time frame, the Indian Rupee lost its gains after a break above resistance on 17 Feb 2020. The 71.364 resistance was later used as support after an earlier break above the resistance level.
Another break above the 72.178 resistance also led to a polarity switch, serving as a springboard for a continuation of the bullish trend and setting a new 2020 all-time high at 73.894.
Conclusion and Projection
To round up, the above analysis points towards a bullish campaign, as the bulls increase their control over the market.
Going forward, we look to take out some profit after attaining the 74.528 resistance level.

No Comments found