USD to INR – Weekly Outlook ( June 16, 2018 )
Weekly India Forex Forecast: USD to INR
Introduction
Welcome to a new weekly overview of the currency pair USD to INR. Here we’ll be taking a look at our projected target last week from a technical standpoint, and recent happening in the U.S economy as well as the Indian Rupees.
Fundamental overview of the U.s dollar and the Indian Rupees
Starting with India, in a bid to strengthen the Indian Rupee, there are expectations that through NRI bonds, the RBI (Reserve Bank of India) will be raising $30-35 billion. This is based on the severe stress currently experienced by Indian banks with rising bad loans.
This week, the most interesting fundamental announcement from the United States dollar side of things is the FOMC (Federal Open Market Committee) Economic Projections. Speculators and India Forex traders alike look out for this announcement because it presents a summary of interest rate forecast of FOMC members. The FOMC is also a major tool used by the Fed pass across monetary and economic projections.
The FOMC statement, on the other hand, is also known as interest rate statement, is often changed at release, and traders find it more to predict the direction of the U.S economy. According to news reports on CNBC, there may be a hike in interest rate by the Fed today Wednesday 13th of June.
As some traders are looking forward to trading the USD to INR currency pair as the FOMC announcements come in today, others are using this as a trigger to exit their positions as volatility is often anticipated.
Technical Analysis
4-Hour (H4) Time Frame

The 4-hour chart gives a clearer view of the recent happening across different currency pairs. As shown above, a bullish regular divergence triggered on the 6th of June leads to a higher exchange rate of USD to INR. This was later followed by buying pressure of classical double inside bar patterns on 12th of June, further leading to an upward surge in the exchange rates. Most recently, another classical inside bar pattern is formed on the 12th of June which we expect to lead to further rise in the price.
USDINR Daily Chart: Bullish Divergence
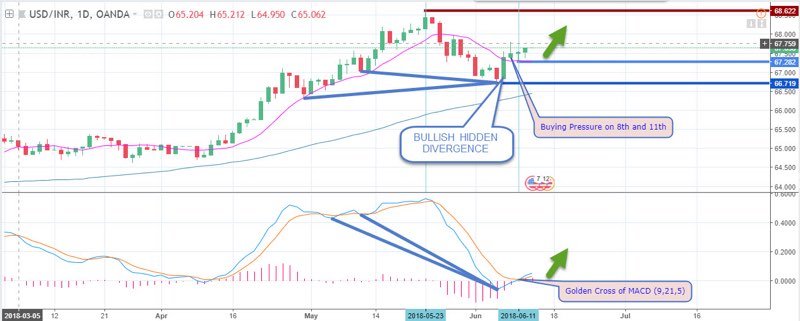
Last week, we anticipated a bullish hidden divergence on the daily chart, which should be triggered by a golden cross of the MACD (9, 21, and 5). The low which we used was violated, however, making reference to a different low the bullish hidden divergence pattern was still triggered by the oscillators golden cross.
USDINR Monthly Chart
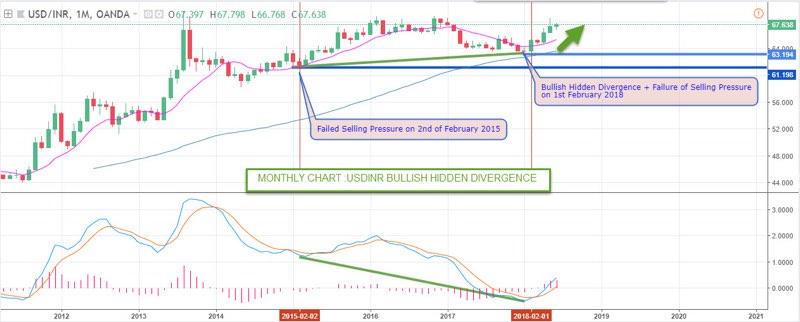
For a broader overview of the technical direction of the pair, it is important to zoom out to a monthly time frame. Comparing the low and failed to sell pressure on the second of February 2015, and higher low and failed selling pressure of 1st February 2018 to the corresponding MACD oscillator on the chart, it is obvious we should be expecting a higher exchange rate on the long term.
Projection and Conclusion
With the above fundamental and technical analysis, you will agree that the currency pair USDINR is currently in a bullish trend and our bias is to take buy only orders till a sign of trend failure occur. With the bullish hidden divergence on the monthly charts, the crisis in the Indian bank sector, and the FOMC reports on the 13th, this trend may continue into the next month.
Top 3 India Forex Brokers to trade USD/INR


No Comments found