BTCUSD Weekly Outlook and Bitcoin Fundamentals , July 16 2020
BTCUSD Forecast and Technical Analysis & Fundamentals for Bitcoin
Introduction
Will the second wave of the COVID-19 put the global economy’s recovery process into jeopardy?
There have been records of new cases and deaths in the increase of the pandemic effects in the global society. This news is of concern to the OlympTrade platform providers because investors need clarity to know where and how to trade BTCUSD during this crisis.
BTCUSD: Technical Analysis
Monthly Chart

Monthly Resistance Levels: 197664.51, 13831.41
Monthly Support Levels: 0.03, 0.16, 2.01, 3.40, 262.94, 4286.84
The BTCUSD has had a tremendous gain in the crypto market for the past years since its general acceptance from 2011 till 2020. The bitcoin has been in an uptrend reaching a high of 19764.51.
The COIVD-19 pandemic did slow down the various transactions around the world that will have either a direct transaction for bitcoin or other transactions via bitcoin.
From the monthly chart, point B has failed to close above point 5, and point A has been tested by point C.
If bitcoin’s price should close below point A, we may see the trend of bitcoin change into a downtrend and expose the support zone of 262.94 levels.
The rejection of price at point C indicates that the buyers don’t want bitcoin to close below that low by pushing back price.
The question is, for how long can the bulls sustain their run in the coming months?
Weekly Chart

Weekly Resistance Levels: 13880.00, 10380.07, 9798.76
Weekly Support Levels: 3850.00, 7469.00
The Indian brokers should note that the resistance level of 9798.76 and 10389.07 has not been breached for weeks since 16th September 2019.
The zone could be a strong point that sellers are eyeing for a short position in the coming weeks. The bearish move can push back the price to the 7469.00 level of support.
The bullish surge that started from the support zone of 3850.00 on 09th March 2020 took bitcoin to the resistance zone of 10380.07 before it lost its bullish momentum. If the bulls can close above the resistance level, it will expose the 13880 zones, but if it fails, the bears will be in control in the coming weeks.
Daily Chart

Daily Resistance Levels: 10495.00, 10247.35
Daily Support Levels: 3850.00, 5623.16, 6472.67, 6940.00, 8109.00, 9182.97, 9267.55
The daily candles show low momentum in the market after reaching the resistance zone of 10495.00 and 10247.35. Since the recent outbreaks of the COVID-19 waves, there has been uncertainty in the market because investors do not want to be caught on the wrong side of the trade.
If the bullish momentum should continue, we may see another retest of the resistance and, if possible, a close above the zone. However, if the bulls rally fails, we shall see the bears push back the bitcoin price from 9267.55 to 9182.97 or further down.
H4 Chart
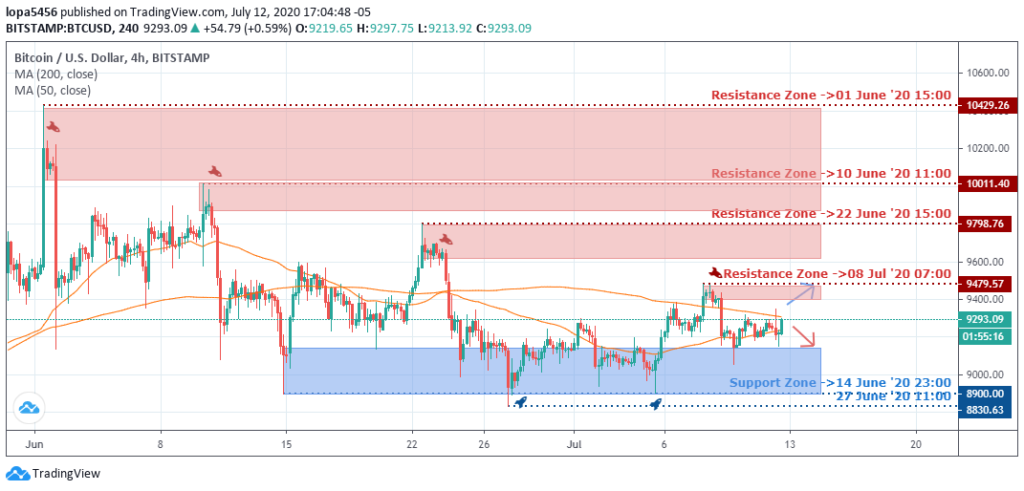
H4 Resistance Levels: 10429.26, 100111.40, 9798.76, 9479.57
H4 Support Levels: 8900.00, 8830.63
From the H4 time frame, we can see that the highs have been getting lower and lower while the support zone has been within the same range, this is a descending triangle pattern.
Should the pattern play out, we expect the bears to push bitcoin lower than the 8830.63 support level?
The Bull’s position is under threat as its momentum is weak, but if the bulls’ can hold the support level, we can get a surge to the upside.
Bullish Scenario:
We expect a bullish trend from the weekly time frame to continue if we can get a close above the resistance zone because the trend has been an uptrend in the past weeks.
Bearish Scenario:
The H4 time frame clearly shows a bearish bias in the nearest future as we can see that the resistances are lower.
There is a need for the bears to take out the current low of 8830.63 if the bearish trend is to continue on the H4 time frame and for the daily time frame bias to confirm it.
Bitcoin BTC News Events
In recent days the bitcoin market has been calm after the bullish rise of 1.6% from the low of last week candle close.
From the USA political happening, a highly popular figure in the Musial entertainment is willing to stand in for presidency. Kanye West, who was one time a friend of President Trump wants to challenge him in the upcoming USA election.
Kanye West, a rapper, has been a friend to bitcoin for a while now, and his political interest may boost the crypto acceptance in the political scene.
Conclusion and Projection
The USA Senate committee had to sit and decide on the hearing about the COVID-19 effects on digital finance and how to handle future occurrences and the role of government in creating a digital currency.
However, the bitcoin market is currently calm for the past days, but with time, there will be an explosion in the BTCUSD market either to the upside or downside.
As days go by, we may see a definite direction on the daily time frame when bitcoin’s market price can close above the 10495.00 resistance level or a close below the support level of 8109.00.

No Comments found