BTCUSD Weekly Outlook and Bitcoin Fundamentals, 23rd April 2021
BTCUSD Forecast and Fundamentals for Bitcoin
Introduction
The joy of the India broker is the rate at which bitcoin has gained acceptance and risen since the first quarter of 2021. They hope to hit the $80000 mark in a few months to come if all things been equal.
The Time Magazine announced it has accepted cryptocurrencies as a means of payment for digital subscriptions with its new partners (Crypto.com) and it is only available for clients in the U.S and Canada.
BTCUSD Technical Analysis
Monthly Chart

Monthly Resistance Levels: 50602.53, 60,000
Monthly Support Levels: 28130.00
At the writing of the report, the bullish trend is still strong and with a lot of momentum as big institutions keep stepping into the crypto market to invest in bitcoin and other cryptocurrencies.
However, we may see a halt of the bullish run around the 60000 level considering that the bullish candles are not getting bigger like the earlier ones that broke out of the previous resistance.
The support level of 28130 was previously a resistance zone, but now it is an established level on the monthly time frame that will act as a buy dip zone for the long position holders.
Weekly Chart

Weekly Resistance Levels: 50645.00, 59600
Weekly Support Levels: 37850.00, 43000, 28850
The COVID-19 crisis birthed an opportunity for the Indian brokers, retail traders and high network individuals as the window for investment in crypto market became eminent during the peak of the pandemic that led the coin into a bullish run for weeks.
We expect the bullish run to continue if the price of bitcoin can close above the 59600 levels with a bullish engulfing candle to create a new high. However, a possibility of reversal can happen at the level of resistance because the level has held for weeks having no trending market.
A drop in price may see the bitcoin hit the 43000 level and if the bear’s momentum is stronger, we may see the price drop lower to the 37850 zone in the nearest weeks.
Daily Chart
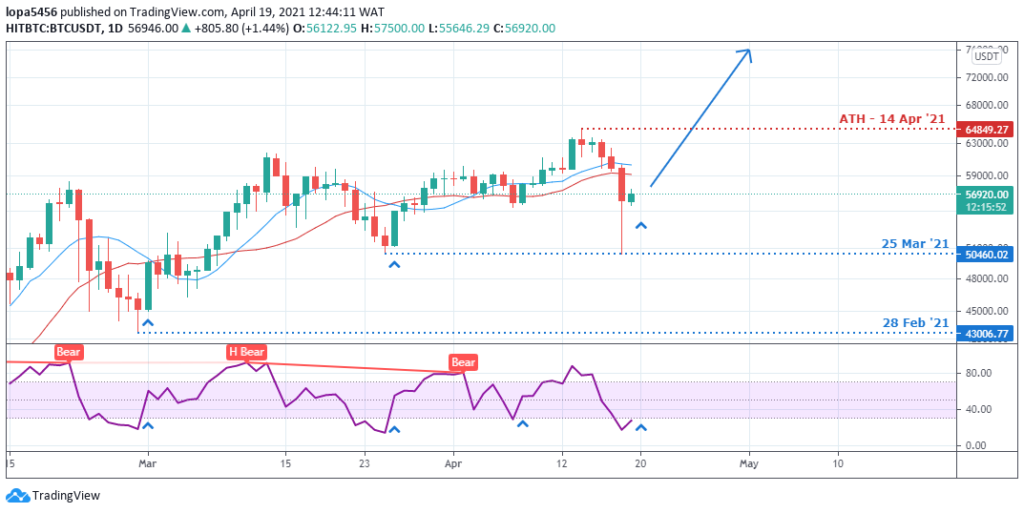
Daily Resistance Levels: 50855.00, 62000
Daily Support Levels: 46250.00, 48000
From the daily time frame, you can see the Bulls are currently pushing back the Bears sell-off pressure the market experienced some days back. They will need a convincing surge above the resistance zone of 62000 for a trend continuation to make an all-time high this month.
If the Bulls cannot close above the zone, we may see the Bears take over the market from that zone for another selling pressure that may close below the 48000 level.
Bullish Scenario:
The Bulls will aim for a breakout above the resistance zone on the daily chart as they expect the correction to be an opportunity for them to buy from the dip at a cheaper value.
Bearish Scenario:
The Bears will expect a selloff from the resistance zones once they see that the bull’s momentum is weak as most investors liquidating their position if they sense any discomforting news about bitcoin.
Bitcoin BTC News Events
Is Loma’s prediction true about the Bulls trap?
He believes that the value of BTC will end up tapping many investors who are new into the bitcoin world and who are just buying because of the recent surge in the value of bitcoin.
Analysts believe that the recent crash in the market was because of a drop-in bitcoin hash rate that happened in China because of a power outage in the mining regions. Some reports say that the rumour about the U.S government planning to charge financial institutions anonymously for money laundering for using cryptocurrencies. This news caused the price of bitcoin to drop from the high of $60000 to $52000.
He observed that the bullish run is not over and the pullback is an opportunity for buyers to compound their gains. He sees the next target of bitcoin to be $70000 in value.
The hash-crash affected the cryptos across the board causing billions in leverage to be liquidated because of the regional blackout that happened in Northwest China causing a large decline in the hash-power of the bitcoin network. This experience will continue to happen in asset class and newcomers should know it while it is a non-event for metals like Gold. On the XAUBTC pair, Gold could rebound about 18% during the hash-crash.
For some smart traders, the know that the asset bull market is not over, instead of entering the accumulation phase, it’s wiser to buy the blood in gold with profit from bitcoin and other cryptocurrencies, as a theory says.
Conclusion and Projection
The Pullback is just a correction phase in the market, and many buyers are looking for opportunities to add more to their long position in the market. The bullish momentum is still strong in the market.

No Comments found