BTCUSD Weekly Outlook and Bitcoin Fundamentals , 29th October 2020
BTCUSD Forecast and Technical Analysis & Fundamentals for Bitcoin
Introduction
Mostly forex trading brokers observe the buildup of the US presidential election. Both parties (the Democrats and Republicans) are doing all they can to win their citizens’ hearts during the election.
BTCUSD Technical Analysis
Monthly Chart

Monthly Resistance Levels: 19891.0, 13764.0, 12325.0
Monthly Support Levels: 6477.0, 4384.0, 3215.2
The BTCUSD price value is gaining a bullish momentum, having reversed the trend from downtrend to an uptrend after the bulls could hold the support level of 01 December 2019 (6477.0) and rally to the resistance levels of 13764.0, which had been the highest high in the year 2019.
If the Bullish momentum is strong, the Indian broker may see bitcoin create a new high this year, targeting the next level of resistance.
However, the resistance levels of 13764.00 may still be a zone that can reverse the bullish trend into a downtrend as it did previously.
Weekly Chart

Weekly Resistance Levels: 13013.10, 12473.00
Weekly Support Levels: 3850.00, 8830.63, 9825
The previous week closed in a bullish candle above the resistance level of 13013.10; we expect the bullish trend rally to continue in this new week if all things are equal.
Can this bullish surge be due to the upcoming US presidential election as investors seek a safe-haven since the US dollar has been generally weak since the covid-19 pandemic?
If the resistance levels can hold, we may see another bearish push from the bears that will take the price down in the coming week towards the 8830.63 support levels.
Daily Chart

Daily Resistance Levels: 13361.0, 12486.61
Daily Support Levels: 11556.37, 10668.56
As of 25 October 2020, the bitcoin created a new high of 13361.00 after closing above the previous high of 12486.61 of 17 August 2020, indicating a bullish trend continuation.
The bitcoin price will need to retest the previous level of resistance to become a support, which will push the trend up higher.
If bitcoin’s price should retest the 12486.61 zones and closes below that zone, it will mean that the breakout was a Feak out, and many long open position traders would be trapped.
H4 Chart
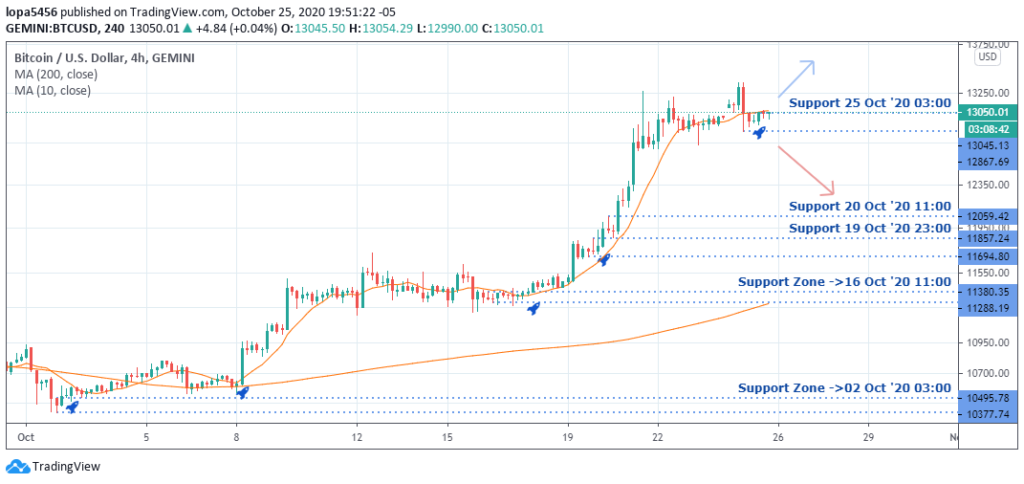
H4 Resistance Levels: 13250.00, 13050.01
H4 Support Levels: 12059.42, 11380.35, 13045.13
The H4 chart is a clear uptrend that took place from the support level of10495.78 as of 02 October 2020, showing the bitcoin value is getting more vital as Intuitions and investors are using bitcoin as alternatives to safe-haven since the US dollar is weak.
If the short position holders can push the bulls back, we need to see it close below the 13045.13 levels to attract a short position for the price to hit the 12059.42 low.
Bullish Scenario:
The general analysis on bitcoin is bullish from the H4 time frame scenario and the daily time frames; we also expect the run to continue if the support level of 12486.61 should hold.
Bearish Scenario:
There is little or no bearish momentum on any of the time frames since the significant determinant is a bullish trend. However, the bitcoin is within a psychological zone where the sellers took control of the market.
If we get any bearish reversal pattern from the daily time frame and four-hour time frame, we may see the price drop back to the support levels of 11556.37.
Bitcoin BTC News Events
The report of PayPal allowing its users to transact crypto businesses through its platform has also attracted JP Morgan, one of the financial giants, to look at bitcoin’s general outlook and consider a potential long-term position for the number one crypto asset.
An analyst from JP Morgan’s Global Markets Strategy believes that bitcoin should compete more intensely with Gold, which is an alternative to currency. Bitcoin needs to further stand the test of time in the market as Gold is worth over $2.6 trillion in the universe’s collection.
They emphasized that bitcoin has high utility over Gold since its core is blockchain, which can be done on a public ledge efficiently, unlike Gold, which needs physical presence for delivery. It’s easier to move $1.5 billion worth of capital through the bitcoin blockchain than the physical Gold.
The utility of cryptocurrencies as a means of payment gives the assets class value. The more economic agents accept it as a means of payment, the higher its value and utility will be accepted worldwide.
Conclusion and Projection
As we expect the election to be a challenging battleground in the USA, we can see a shift of interest from the investors’ side of view by using bitcoin as a means of savings. The second COVID-19 waves in the European zones are also of concern to the Indian brokers and other traders.
A close below the support of 13045.13 levels on the four-hour chart will push BTCUSD price down, but a possible continuation of uptrend is still possible should the value of bitcoin closes above the 13250.00 resistance.

No Comments found