BTC/USD Weekly Outlook and Bitcoin Fundamentals , August 11 2020
BTC/USD Forecast and Technical Analysis & Fundamentals for Bitcoin
Introduction
India brokers are interested in the bitcoin’s current direction as July closed in a bullish candle. The BTC/USD pair is volatile now as we can see more buyers and investors coming into the market.
BTC/USD: Technical Analysis
Monthly Chart

Monthly Resistance Levels: 19891.0, 13764.0, 12325.0,
Monthly Support Levels: 6477.0, 4384.0, 3215.2
The support level of 01 December 2018 (4334.0) acted as strong support for the Bulls by rejecting the advancement of the Bears at that zone as at 01 December 2019 (6477.0) the Bulls were able to rally the price of bitcoin to the previous inside bar resistance level of 01 August 2019 (12235.0).
Can the bulls still control the bitcoin market by overcoming the resistance level of 01 June 2019 (137764.0)?
If the Bulls can overcome the level in the nearest future, we shall see the price rise to the all-time high level of bitcoin of 19891.0.
The Indian broker’s psychological zone is the 13764.0 price of 01 June 2019, because the area will attract both the bears and bulls.
If the bulls surge should fail, we may begin to see the bears push back the bitcoin price to the 6477.0 support level.
Weekly Chart

Weekly Resistance Levels: 13880.00, 10933.26,
Weekly Support Levels: 3850.00, 7469.00, 9798.76
From the weekly time frame, we can see how the bears were able to push down the price of BTCUSD from the 10322.26 to the low of 09 March 2020 (3450.00) before the bulls found support at that zone.
From the support of 3450.00, the Bulls were able to rally the price back to the previous resistance level that put the bears in control.
In recent weeks, the bull’s surge came with momentum by closing above a former resistance zone turned support of 10 February 2020.
This move signals more buying pressure to the upside by the bulls, and there is a possibility that the next resistance level of 13880.00 (24 June 2019).
Daily Chart

Daily Resistance Levels: 9792.00, 10018.67, 10428.00, 11916.68, 12134.29
Daily Support Levels: 9182.66, 8970.00, 8533.98, 8106.70
The bullish break above the descending triangle trend line indicates the bull’s signal to the uptrend. The support ones of 11th and 04 May 2020 resisted the bear’s pressure to the downside within the zone before the upward surge.
The bullish day candle that broke and closed above the 01 June 2020 (10428.00) price did turn the level into support after a retest of the zone.
As at this report, if the bulls fail to go above the 12134.29 resistance level, we may see price drops back to the 10428.00 level in days to come.
However, if the price is above the resistance, we may see a further rise in the bitcoin price in the coming weeks.
H4 Chart
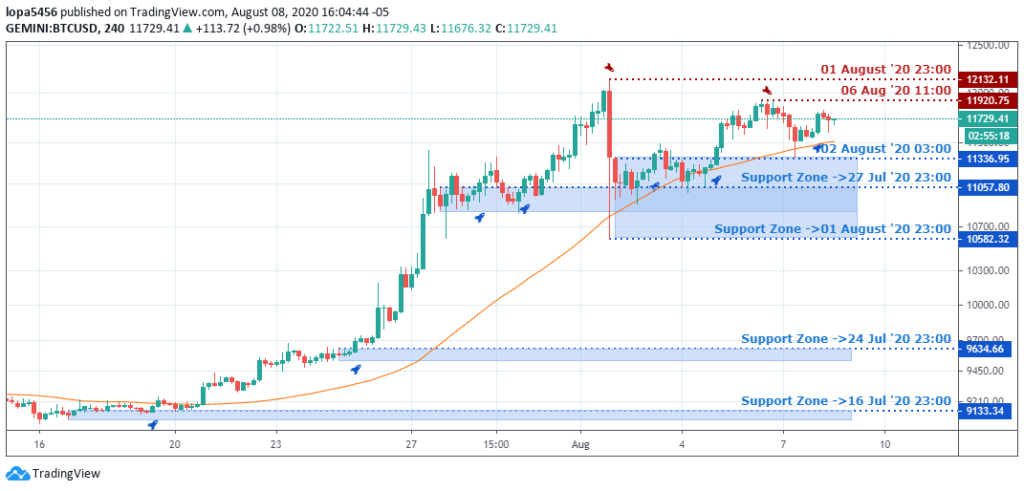
H4 Resistance Levels: 11920.75, 12132.11
H4 Support Levels: 9133.34, 9634.66, 10582.32, 11057.80, 11336.95
The H4 time frame shows the gradual rise of the bullish trend at the growth from the support zones of 9133.34, 9634.6, and 10582.32. The uptrend stills favor the bulls at the time of this report.
It is also essential for the Indian brokers to note that the sharp drop in the bitcoin price at the resistance level of 12132.11 shows that there are bears at that zone hoping to take down the price value of bitcoin.
The resistance zone of 11920.75 and 12132.11 may bring in the bears, considering that it’s within the round-number resistance at $12000.00.
Bullish Scenario:
Looking at the time frames, we can see that the trend is bullish in all. The Bulls are in control of the market for weeks, having closed above some psychological levels in the bitcoin market.
We also need to see the bulls close above the 12134.29 level to get another swing to the upside.
Bearish Scenario:
The bears have lost momentum in the past weeks, losing grip on the June resistances levels of 9792.00, 10018.67, 10428.00, to the bulls on the daily timeframe.
The bears will need a secure zone to take back the bitcoin price from the Bulls.
Bitcoin BTC News Events
Can the rise of bitcoin price be compared to that of the Bank of America in terms of market Capital?
The market cap for Bank of America is around $226 billion compared to the capital market of bitcoin that is approximately $217 billion from the research and information obtained from other sources like yahoo finance.
Bitcoin is known for its volatile moves, which are the main attraction for investors and Indian brokers.
The COVID-19 changed the world’s view, halting the way businesses were carried out among business partners and countries. Before the pandemic, the BTC/USD capital market was at $145 billion, while the USA’s central bank did pump $168 billion into the economy as of March 2020, affecting the traditional market.
Conclusion and Projection
Amid the COVID-19 crisis affecting the financial market, we can see that some Institutions and other investors are buying more of bitcoin as a haven.
We are likely to see more investors buying bitcoin in speculation for an uptrend into Q3 2020.

No Comments found