USDINR – Weekly Outlook & Analysis for July 8 2019
USDINR Forecast & Technical Analysis for India Forex
Introduction
There are uncertainties if the US congresses are willing to extend the scheme supplementing jobless benefits beyond July 31. Some states are having new cases of coronavirus, and the numbers are increasing.
The Indian rupee did not do too badly against the US dollars as traders on IQ Option platform and other online brokers force the USDINR into a consolidation phase month even in a struggle to cope with the number of new cases in the country.
India’s Fundamentals
After the Indian government’s ease of lockdown policies amid the coronavirus pandemic, the jobless rate in the urban areas dropped to 12.0% from the previous 25.8% data. Also, that of the rural areas went down to 10.5% from the recent 22.5% data.
These feeds are good news for the Indian forex, as it will attract investors into the market.
U.S. Fundamentals
The early States with an increasing number of new coronavirus cases are in the Southern and Western parts of the USA, and they are the ones with the least restrictions at the peak of the pandemic and the first to relax them.
The survey carried out by the US Bureau of Labor Statistics helps to measure the numbers of new individual collection of job openings, hires, recruitments, and businesses.
The US jobs opening is a lagging indicator, but it is still significant for investors to know the health of the economy. During the peak of the COVID-19 crisis number of available positions dropped as employers went from hiring to a workforce reduction.
A positive reading will be data more reliable than the forecasts, which means bullish for the USD, while a weaker reading will mean negative and bearish for USD.
The forecast is 4.850M, and previous data was 5.046M
USDINR Technical Analysis
USDINR Long term Projection: Bullish
Monthly Chart

Monthly Resistance Levels: 77.008. 74.9450
Monthly Support Levels: 63.25, 66.8113, 68.3075
From the chart above, we can see the month starting with a breakdown of the bullish accumulation from the resistance zone.
As the regular bearish divergence is also building up, we may see sellers’ taking over the market in the coming months and pushing the price to the low of July 01, 2019.
Weekly Chart

Weekly Resistance Levels: 75.496, 76.33, 76.822, 77.416
Weekly Support Levels: 68.123, 70.194, 72.066
As of April 27, 2020, a bearish divergence also confirms rejection of price at the resistance level of March 16 and April 20 (77.416 and 76.822), respectively.
From the weekly time frame, it is evident that the bears are in control of the market for the past two weeks. The Indian rupee did gain against the US dollar in the India forex market after a long while.
If the selling momentum continues, we may see the 72.066 zones exposed in the coming weeks.
USDINR Medium Term Projections: Bullish with High Volatility
Daily Chart

Daily Resistance Levels: 75.794, 76.330, 76.822, 77.416
Daily Support Levels: 71.332, 71.073, 71.886, 71.472, 74.360, 73.450, 73.990, 74.360
The above daily chart shows a firm rejection of the USDINR on March 19, 2020, forcing the pair into a range.
It has been ranging between the resistances of 77.416 and 76.822, March 19, 2020, and April 21, 2020, respectively. Also, the support levels of 74.360, 73.450, and 73.990, respectively.
In this recent swing, the bears were able to push down the price to the support zone of 74.360 from the resistance zone 76.330, showing dominance in the India forex.
At the close of the daily candle, it shows that few sellers were in the market. The zone is a psychological area in the market because buyers have been able to take over the market from that zone.
Online brokers watch the final reaction of the price before placing orders due to uncertainty in the market.
4HR Chart
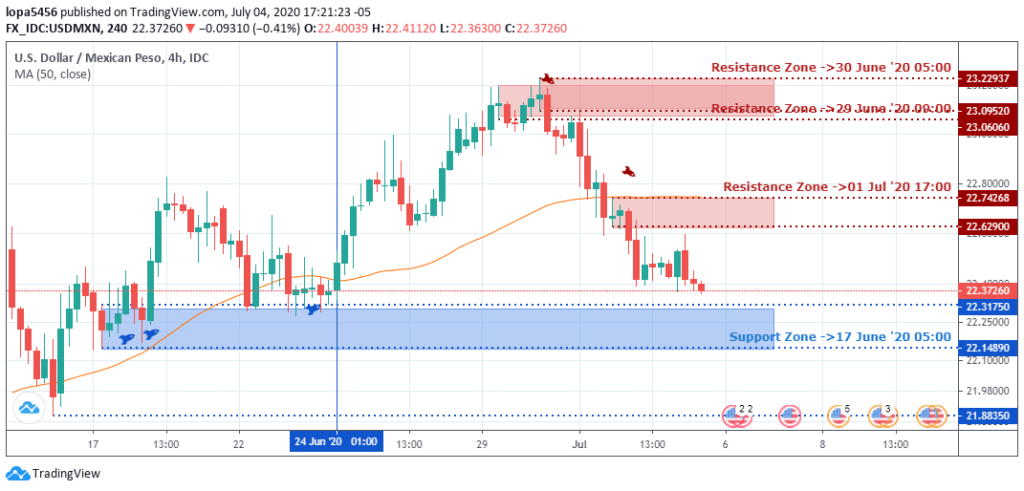
4Hour Resistance Levels: 76.198, 76.33, 75.44, 75.538, 74.554
4Hour Support Levels: 74.266, 75.232
The bearish surge in the H4 chart above shows the dominance of sellers in the market since June 18, 2020, and June 24, 2020.
The support zone of June 09, 2020, couldn’t hold after multiple tests before the sellers broke out below the 75.232 zones.
The Support level of 74.266 is where USDINR is currently resting after the close of a Marubozu candle. In the coming days, we shall have a clear direction on price.
Bullish Scenario:
A break of selling resistance at press time upon entering the support zone at publication time may be all the bulls need to set the ball rolling for a sharp price recovery into the week.
Bearish Scenario:
The bears have been able to take over the market for days and have strongly pushed down the price to the demand zones. The bearish scenario can continue if they can close below the 73.450 support level on the daily time frame.
Conclusion and Projection
Due to the increase in numbers of new cases, investors are uncertain about the nearest future because the US government has placed reopening of other sectors on hold. According to some analysts, if new containment measures are put in place, it may add to the labour market problem.
The USDINR is in a downtrend on the H4 time frame, and it is also resting on a support zone that is strong on the H4 and Daily time frames. If the bears fail to close below the daily support zone, we will likely see the bulls push back the price to the upside.

No Comments found