Bitcoin to USD ( BTCUSD ) Weekly Outlook , January 3 2019
BTCUSD Forecast and Technical Analysis & Fundamentals for Bitcoin
Introduction
The year 2019 ended with December closing within the high-low range of the long bearish November candlestick on FBS broker and exchange terminals, a setup similar to the collection of bearish action in December 2018.
Should we expect a break above significant bearish resistance ($7772.71) of December 2019? Let’s go on to analyze the charts.
BTCUSD Technical Analysis
Weekly Chart
Resistance: $13880.00, $10955.48, $10350.00, $9586.50. $7870.35
Support: $6515.00, $6425.00

In the last weeks of 2019, the BTCUSD signals a regular bullish divergence on December 16, 2019, after attaching the stochastic oscillator.
A price close above the $7692.98 resistance will further reinforce the bullish campaign for a projected price target around the $10350.00 level.
On the contrary, if the Bitcoin price fails to close above the critical resistance level on all Bitcoin broker platforms, then we should expect a rejection of the support level $6425.00 established by the regular bullish divergence.
Daily Chart
Resistance: $10350.00, $9586.50, $$8631.60, $8231.04, $$7870.35, $7772.71, $7296.19, $
Support: $6515.00, $6425.00, $7692.98, $7432.00, $7524.46

Looking at the daily chart above, the BTCUSD is currently enclosed in a bearish channel built from both regular bullish and hidden bearish divergence patterns.
Double bearish accumulation patterns signaled on December 26, 2019, show that the pair may still head south, perhaps in the early parts of Q1 2020.
If the bulls fail to drive the Bitcoin price above the MA-50, then we should expect a continuation of the bearish trend.
4Hour Chart
Resistance: $7692.98, $7449.68, $7524.46
Support: $6425.00, $7052.00, $7069.18
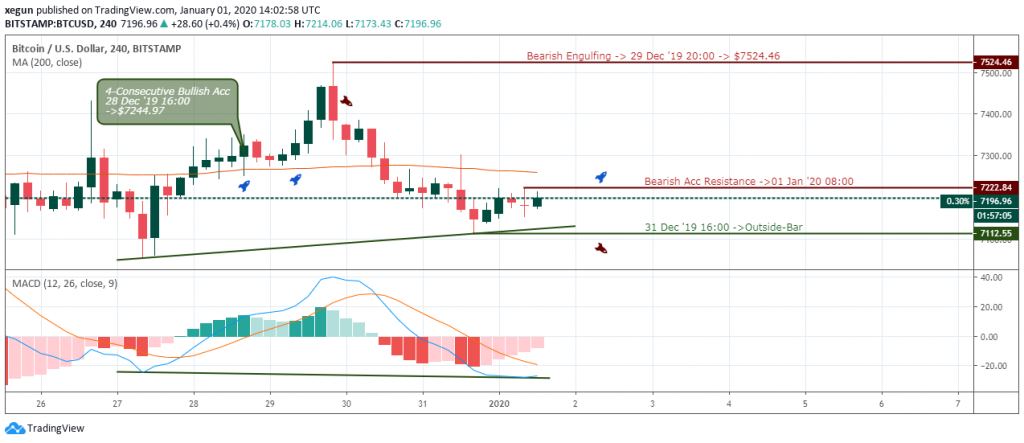
A view from the 4hour time frame shows a buildup of hidden bullish accumulation, where a price close above January 01, 2020, resistance ($7222.84) should serve as confirmation to enter a long-only order.
Failure to close above the resistance level would stress the huge presence of bears in the market.
Bitcoin Fundamentals
Chinese Bitcoin Miners Under pressure From Authorities Due to Electricity Shortage
Miners of Bitcoin (BTC) in the province of Sichuan China are reportedly under pressure from local authorities to scale down their operations owing to a shortage of electricity witnessed during the dry season.
According to reports in the Asia Times, on December 29, electricity supply drops drastically during the dry season, which extends from October through April. Owing to this, local authorities in Southwest China are clamping down on mining companies to reduce operations and ensure adequate supply throughout.
Conclusion and Projection
After a price plunge of about 53.71% from the 2019 all-time high ($13880.00), a likely scenario is a price plunge towards the 50-monthly Moving Average, where we expect the price to find support at $4794.62.
Let’s wrap up the analysis on the monthly time frame.
Monthly Chart
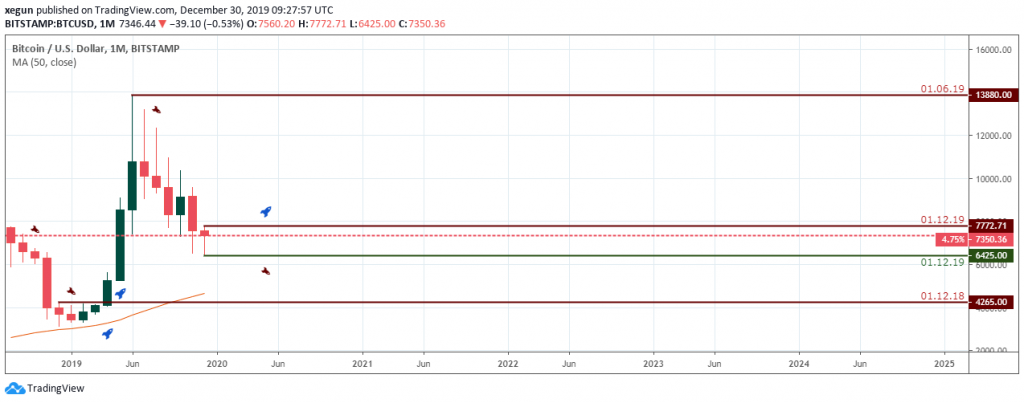
The monthly chart above showing a collection of bears after the closing price of December 2019 confirms an increase in selling pressure.
However, we should trade with caution at this level to avoid holding on to the bag in a bullish correction wave from June 01, 2019, high ($13880.00).
In summary, the Year 2020 should be a year where we see the Bitcoin price completing the Elliot corrective wave-C as we expect a hike in the price of the number one cryptocurrency by market cap.

No Comments found