BTC/USD Weekly Outlook and Bitcoin Fundamentals , June 4 2020
BTCUSD Forecast and Technical Analysis & Fundamentals for Bitcoin
Introduction
The COVID-19 pandemic has created fresh waves of attention and creates an increase in demand for BTCUSD and others cryptocurrencies on trading platforms as it is shifting its reputation into an innovative technology and thriving sector within the financial market.
BTCUSD Technical Analysis
Monthly Chart

Are brokers going to see another rise of bitcoin in the coming month should price close above 117280 resistance zone? The previous bearish move of bitcoin to the moving average has been acting as dynamic support whenever price approaches at the moving average line.
BTUSD gained a 14.33% increase in price as of this report for the month of May 2020. If the bulls’ momentum cannot close above the resistance, we can witness a sharp drop of the bitcoin.
Weekly Chart

For the past weeks, bitcoin had recovered 127.81% of its value during the trend, and it has been an uptrend after the regular bullish divergence supported the bullish trend to the upside, also from the stochastic indicator we have a support to the uptrend.
The resistance zone of 7.02.2020 can still hold; we may get a rejection of price, setting another opportunity for the bears to take over.
A close above can give an additional 12% increase of the bulls rally to the next resistance level. If it cannot close above, we may see a ranging market or a complete reversal of the trend.
Daily Chart
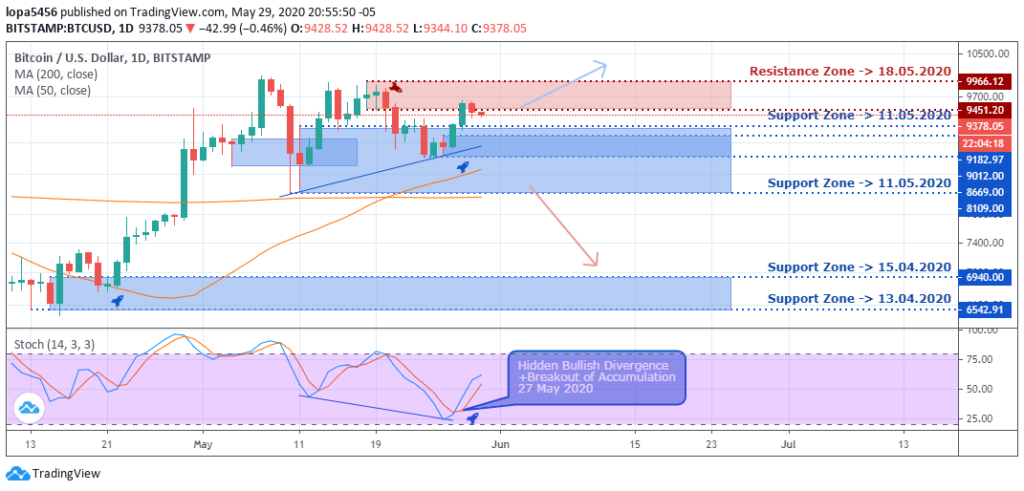
The bitcoin price has been ranging for some days between the resistance zone of 9866.12 and 9182.00 of the support zone. While ranging, a hidden bullish divergence was setting up and confirmed on the stochastic on the 27 May 2020 that is pushing the price up.
However, the resistance zone may prove to be a hard nut to crack for the bulls, for they are struggling to close above the 9966.12 zone.
That resistance zone is a psychological zone for brokers, investors, and traders as they await the decision of bitcoin around the zone.
H4 Chart
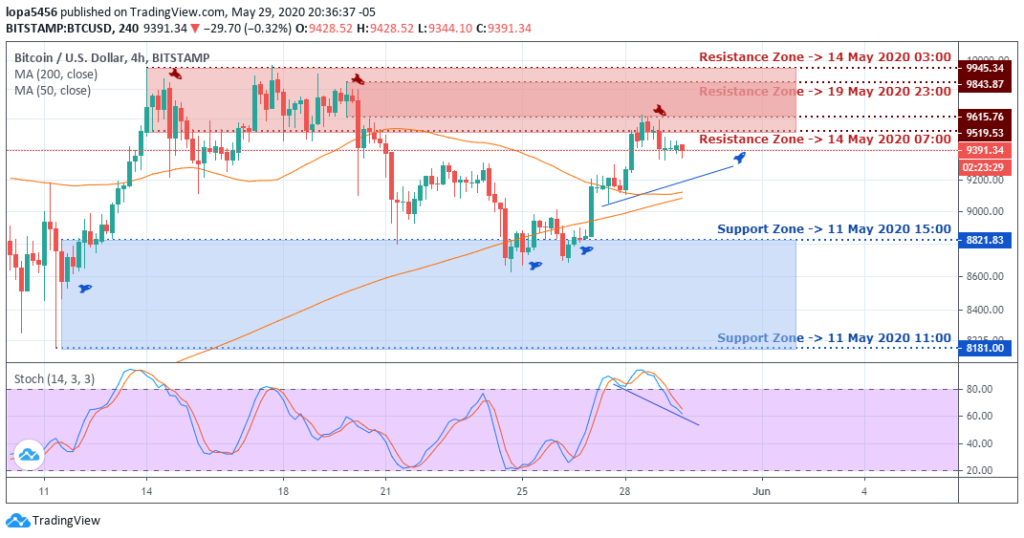
In the past days, the price tested the resistance zone overtime and has equally shown rejection of price at the zone. On the four hourly candles, we can see how the bullish momentum is fading away, showing few buyers in the market, giving room for sellers to take over.
The bulls pushed the bitcoin price up after the double bottom formed at the support zone of 11 May 2020 (8821.83). The BTCUSD gained 11.31% on the price increased from the support zone.
Bullish Scenario:
They have built a bullish momentum over the weeks in the bitcoin price war, and it has a general gain of 163.71% in 119 days of its bullish run. However, the bulls rally will continue if the BTCUSD price can close above the 10000 price zone.
Bearish Scenario:
A bearish scenario can come into play on the four hourly time frames if the bulls cannot close above the 9966.00 resistance level. This will ultimately bring in the sellers once they can get such a confirmation of the trend reversal. There have been signs of rejection of price to the top side anytime bitcoin tries to go above the 9600 levels.
Bitcoin BTC News Events
Goldman Sachs is one of the leading hedge funds managers worldwide, and they are heavy traders and investors of our time.
However, during a recent discussion on the US economy on the 28 May 2020, Goldman-Sachs does not see bitcoin as an asset class from its presentation and discouraged clients from investing in bitcoin supporting his claims that a lot of cryptocurrencies are used for illicit businesses.
Goldman Sachs call could increase the awareness of high net-worth individuals to bitcoin BTC.
Conclusion and Projection
The global pandemic of the COVID-19 hit made the financial market tumble. This made the Feds, and Treasury departments stepped into the situation with unprecedented relief; measures were also taken in the aspect of digital privacy and safe-haven asset speculation.
Brokers are watching how the bitcoin market will react in the coming days because nothing is certain about the financial market. A close above the 10000 zones will change the dynamic of the bitcoin market, and a failure could also bring a heavy loss in price value to the downside.

No Comments found