Bitcoin to USD ( BTCUSD ) Weekly Outlook , March 7 2019
Technical Analysis & Weekly Forecast for Bitcoin
Introduction
A steady strength gain among altcoins hints positive sentiment towards the entire cryptocurrency industry at larger. Furthermore, Bitcoin price closed bullish last week to signal bullish pressure which could lead to price gains in the coming week.
Join us as we look deeper into the technical and fundamental events for this week.
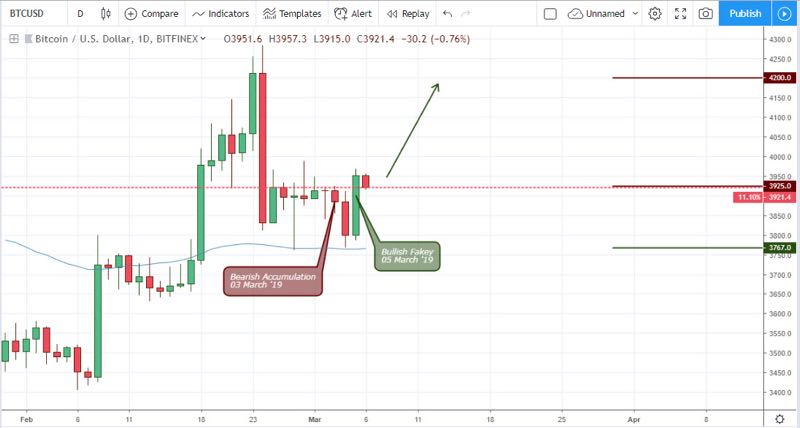
BTCUSD: Daily Chart

New burst of hope is unleashed for HODLERs as the BTCUSD burst out of a bearish congestion on February 08 ’19. The Bitcoin price gains were quickly corrected after the bullish surge at the closing price of the same day. The price retracement ended by the formation of a bullish accumulation formation on February 16 bringing the bulls a 14.5% gain.
It’s really been a rollercoaster looking at the daily charts, as a dark cloud cover erased the gains by about 11.3%. Further decline of the bitcoin price was halted by the moving average, and a bullish continuation pattern in the form of a fakey was triggered on 05 March ’19 as shown on the chart update below.
Bitcoin Fundamentals
Bitcoin: In the News
The IDC Projects a 2.9 billion dollar in global blockchain spending in 2019
The IDC – International Data Corporation in a recent publication on 4th March ’19 projected about $2.9 billion to be allocated to blockchain solutions globally. The report which analyzed data in 19 industries; 10 technologies; and 15 use cases in 9 geographic regions forecast an 88.7% increase compared to last years $1.5 billion.
Regulatory Adoption: Russia Parliament adopts Domestic Crypto Legislation
In a bid to formulate the national cryptocurrency legislation, the Russian parliament on 05 March ’19 made a publication on adopting a bill on Digital Financial Assets.
According to Volodin Vyacheslav, chairman, and co-author of the bill, amendments are focused towards improving on digital rights.
BTC/USD: 4-HR Chart
Above is a 4hour chart, showing the price collapse triggered by tired bulls and stressed by the bearish divergence pattern. This forced the Bitcoin price to trade below the mA-65.
Conclusion and Projection
With a buildup of bullish pressure on the weekly chart, we look forward to price hitting the crtical resistance level of 4384.0 going forward into the new week. On the other hand, a bearish price close below the 3761.2 support of the weekly chart would spell doom for the bulls.
BTCUSD: Weekly Chart
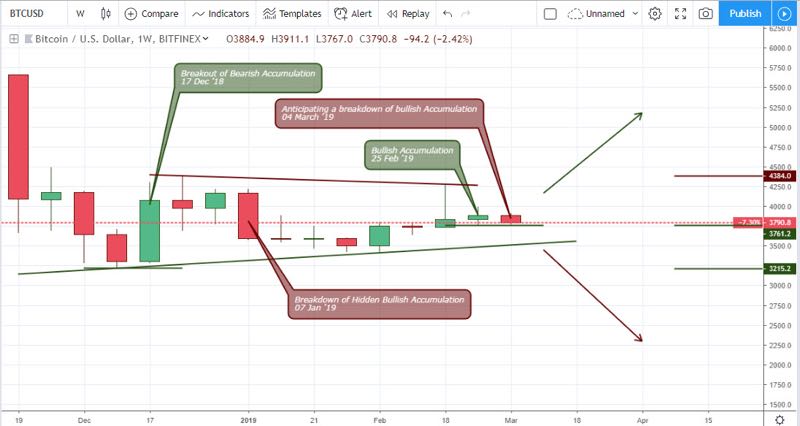
The above weekly chart highlights the current price patterns driving the price from a weekly perspective as well as critical support and resistance levels to look out for as trader. For risk averse trading, you may want to wait for a price breakout or breakdown of either the 4384.0 resistance or the 3761.2 support.
If you’ve been following our weekly analysis, you’ll notice that the data feed used is from Bitfinex, a crypto broker that best illustrate the technical price patterns mentioned above. That said, you may also want to take a look at our Olymp Trade review, at the broker section of our website as a way to support the work we do

No Comments found