Bitcoin to USD ( BTCUSD ) Weekly Outlook , February 22 2019
Technical Analysis & Weekly Forecast for Bitcoin
Introduction
This week makes the third that the bitcoin price has closed higher, after trading towards the 3215.2 support of the weekly chart below. Join us as we walk you through the technical and major fundamental event in the cryptocurrency market.

BTCUSD: Monthly Chart
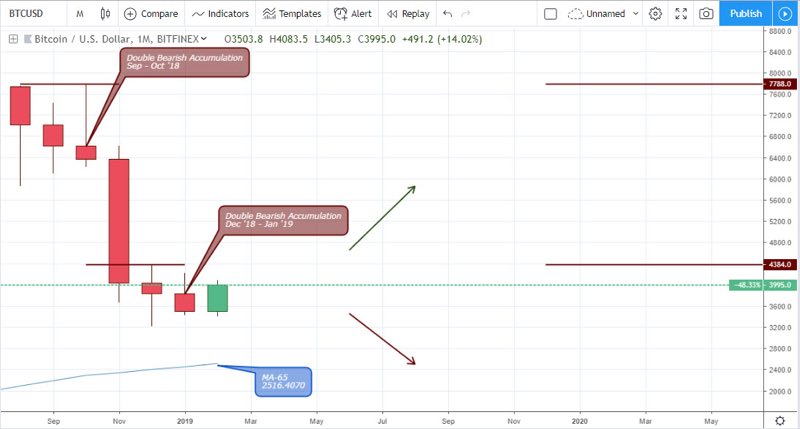
Bitcoin price currently trades at about 18% from this month’s open, and head towards the double bearish resistance of 4384.0. We should look forward to a price close above the resistance level above before we can consider buying from this time frame.
BTCUSD: Daily Chart
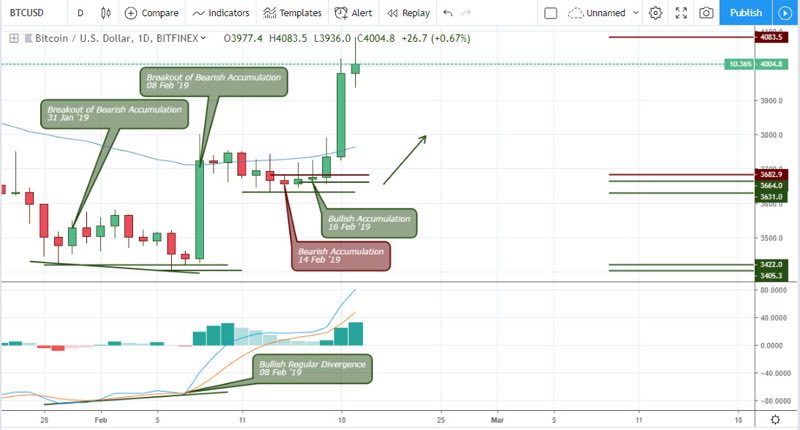
A buildup of MACD divergence as illustrated above revealed a weakness of bearish trend from the breakout of bearish pressure from the weekly chart. The long bullish candle on 08 February ’19 confirmed the failure of selling pressure and consequently resulting in the origin of a bullish trend. The bullish volatility was later followed by a retracement that ended at a polarity switch from bearish to bullish pressure as triggered on 14 February and 16 February ’19.
From the chart above, you’ll observe that price has blown through our profit target and this is a good time to exit in profit.
Bitcoin Fundamentals
Upcoming Events
CME: February Last Trade 22 February 2019
The Bitcoin futures contract will be closing for the month, tomorrow 22nd February ‘19 at exactly 16:00 GMT.
Speculators and Binomo traders alike look out for such fundamental events as they are likely to bring volatility into the market.
Crypto Assets Conference February 25, 2019
Coming up next week February 25 is the crypto asset conference. A conference primarily for individuals, crypto enthusiasts, and companies that would like to get more understanding of crypto assets and are curious to interact with practitioners and asses different implementations of the technology.
Technical
BTC/USD: 4-HR Chart
A view from a 4hour chart perspective shows how the bullish trend started from a bullish fakey pattern on February 14 and February 15 ’19. Both patterns offer an entry with a tight stop loss, as shown on bitcoin brokers platform featured on the broker section of our page. An earlier triggered bearish pressure gave way to a bullish thrust on 16 February ’19 00:00.
As an update to the 4hour chart analysis, the bitcoin price has soared 13% in the bullish direction from the bullish fakey pattern.
BTC/USD: 2-HR Chart
Similar to the 4hour chart, the 2hour time frame triggers bullish patterns, but this time in the form of a breakout of bearish pressure and bullish hidden divergence on 17 February ’19 20:00. The trend starts to slow down at the formation of an opposite bearish divergence and bearish pressure on 19 February ’19 16:00.
Conclusion and Projection
Approaching the BTCUSD chart from a birds-eye view, we will conclude that the pair is enclosed within the bullish pressure support from a weekly time frame and the double bearish pressure resistance on the monthly time frame. By this, we keep a watchful eye on the critical support and resistance levels of 3215.2 and 4384.0 as the short term bullish trend begins to lose steam.

No Comments found