Bitcoin to USD ( BTCUSD ) Forecast & Weekly Analysis, October 16 2018
Bitcoin to USD Weekly Forecast & Analysis for Bitcoin Brokers
Introduction
This week, we’ll pay more attention to previous and upcoming Bitcoin fundamental events in October as well as the technical analysis of the daily 4hour and 2hour charts.
Fundamentals
From the fundamental analysis side of things, this week, we’ll look more into the previous events, how they coincide with our price action patterns, as well as future events and how we feel they’ll play out this week.
Review of Past and Upcoming Events in the Bitcoin Community

The above daily chart will be our point of reference for the past and upcoming fundamental announcements that may affect the Bitcoin to USD exchange rate.
CME Bitcoin Futures Last Trade Date 27th July
Starting from the last trading date of the CME Bitcoin Futures, the price displayed a bullish accumulation pattern which you can get more details from the technical analysis section of this post. A price action pattern of this kind forming on such a significant date, while the price is in a bullish trend is worth paying attention to.
AMA on Telegram 1st August
Not too long after the CME Bitcoin Futures last date, the Bitcoin AMA was hosted on Telegram, where bitcoin and cryptocurrency enthusiasts can have their questions answered by SpaceChain’s CMO Eric Desatnik and Co-founder Zee Zheng.
As a result, the bullish accumulation pattern formed at the CME last date failed to a bearish breakdown pattern, causing the pair to flow into a downward trend spiral.
Cboe XBT Expiration Date 15th August
As the bearish trend winds down to an end, the price chart showed bullish accumulation patterns in a bearish trend, as well as a bearish accumulation pattern just within the expiration date of the Cboe XBT expiration date.
This bearish accumulation pattern failed to a bullish breakout pattern, indicating bullish sentiment.
CME Bitcoin Futures Last Trade Date 31st of August
The last day in the month of August happened to be the last trading date of the CME Bitcoin. The price pattern indicated bearish accumulation patterns that should translate to a short-selling trade, on the contrary, there was a shocker. Price broke out of the bearish pattern and continued its upward trend, which later failed to a bearish engulfing pattern four days after.
Bitcoin Core v.0.17.0 Release 8th September
The release of the Bitcoin Core version v.o.17.0 brought a positive sentiment, as it coincides with a bullish accumulation pattern within the same time range. This establishes a bullish support at the low of the bullish accumulation price pattern.
Cboe XBT Expiration Date 19th September
A double bullish accumulation pattern was formed at the Cboe XBT Expiration, leading to a double bottom of the support formed on the Bitcoin core version release update.
CME Bitcoin Futures Last Trade Date 28th September
Similar to the bearish accumulation pattern formed on the 23rd of September, another bearish accumulation pattern was formed on the 28th, which aligns with the last trade date of the CME Bitcoin Futures. The daily technical analysis section sheds more light on the price action patterns that ensued.
Upcoming Events
Cboe XBT Expiration Date 17th October
Coming up this week is the expiration date of the Cboe XBT. This has been a significant event that often determines the course of the Bitcoin price, as crypto brokers and traders pay close attention to price patterns around this announcement period.
Margin Trading and Funding on COBINHOOD 19th October
Cobinhood, one of the top bitcoin brokers, now allow margin trading and funding. This will start on the 19th of October, this same week, as Cobinhood offers zero charges on trading as well as a leverage of 3X on a selected trading pair.
CME Bitcoin Futures Last Trade Date 26th October
As the last trading date of Bitcoin CME Futures, we expect this to affect the price of Bitcoin to USD. We’ll be keeping watch of the price action patterns that will be formed around this event.
Technical Analysis
There are no much changes on the monthly and weekly time horizon, hence we are sticking to the daily, 4-hour, and 2-hour charts for technical analysis.
BTCUSD: Daily Chart
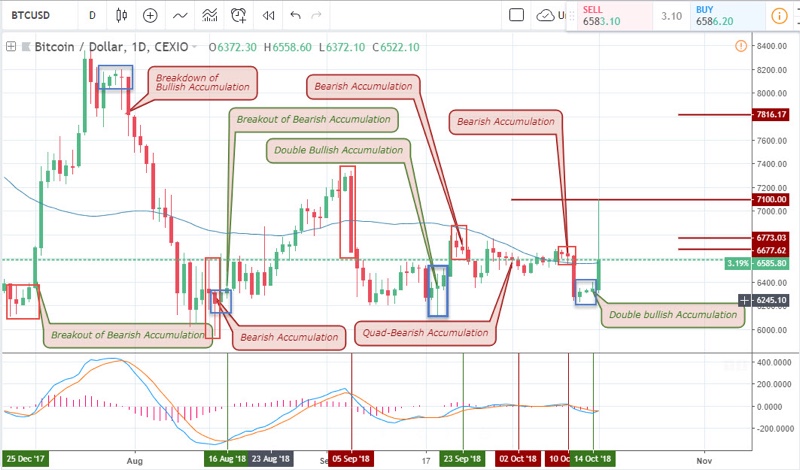
This is the same chart we used in analysing and spotting the dates of the previous and upcoming fundamental events. Here we’ll look more at the technical events.
A picture they say speaks louder than a thousand words. The most recent event was the bearish accumulation pattern which aligned with the Bitcoin cash hackathon which took place last week Wednesday the 10th. This was later followed by double bullish accumulation patterns that were formed over the weekend and took effect this week Monday.
BTCUSD: 4-hour Chart
Price broke out of the bearish accumulation pattern signalling the end of the bearish trend. It’s important to note that when patterns such as this occur and is more recent than the bullish accumulation pattern formed on the daily chart, we exit our current trade direction and enter into the opposite direction, which in this case is a bullish trade.
This brought about the sudden bullish thrust of the Bitcoin to USD exchange rate.
BTCUSD: 2-hour Chart
The 2-hour chart shows even better insights into the price dynamics as it started with a bullish regular divergence pattern on the 12th, followed by a double bullish accumulation pattern on the 14th and another bullish accumulation pattern on the 15th.
For the breakdown of the bullish accumulation pattern to be tradeable, the price will have to close below the second bullish candle. However, this could give short-term scalping opportunities.
Conclusion and Projection
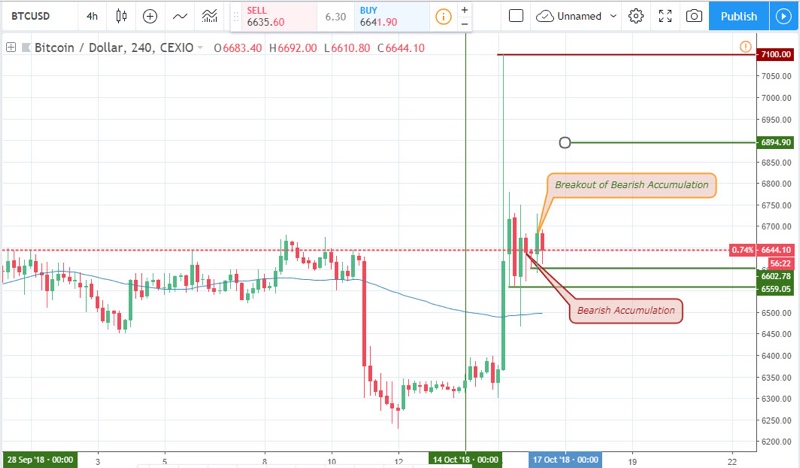
For now, the Bitcoin to USD pair still remains in a short-term bullish trend as the price fail to close below the bullish accumulation pattern. A breakout of a bearish accumulation pattern is recently formed, triggering long buy trade at $6644, with a stop loss placed slightly below the $6559 support level. Price is projected to hit the $6894 price level.
Top 3 Bitcoin Brokers to trade BTC to USD


No Comments found