Bitcoin to USD ( BTCUSD ) Weekly Outlook , April 5 2019
BTCUSD Forecast: Technical Analysis & Fundamentals for Bitcoin Price
Introduction
Finally, our long-anticipated surge in Bitcoin price from a monthly time frame is triggered. The bears were seen to cave into bullish pressure after the end of Q1 2019 as shown on the Monthly chart below. Let’s go ahead and look at interesting events in the cryptocurrency market as well as technical patterns responsible for the current up shoot in Bitcoin price.
BTCUSD Weekly

The bullish trend was confirmed after a bullish accumulation pattern signaled on 25 February ’19 with support at 3761.2, and 3215.2.
BTCUSD: Daily Chart

Close to the end of the first quarter of 2019, the BTCUSD from a daily time frame simultaneously triggered a MACD golden cross with a close above a major resistance level. The lower price low of the divergence pattern was initiated by a bullish Fakey pattern with support at 3771.7.
Bitcoin Fundamentals
Speculative Adoption: Bitmain target the Bitcoin Halving in 2020 as a critical moment for Breakthrough in Mining
Following a challenging 2018 for the crypto mining industry, Bitmain a top player in the crypto mining industry in a publication by South China Morning Post will be targeting the Bitcoin 2020 block reward halving for the release of its new mining gear and hardware. Bitmain after going through a drought in mining revenue hope for a reverse as they project an increase in demand for Bitcoin.
BKCM’s Brian Kelly Projects Next Bitcoin target
In an interview with CNBC, Brian Kelly CEO and founder of BKCM LLC, a digital currency investment firm projects $6000 as the following price objective for the Bitcoin price.
He mentioned that the participation of institutional investors among all technical indicators used by the firm supports the current trend and surge in the price of Bitcoin.
Security Token Summit April 08 2019
Coming up next week at the Ritz Carlton Hotel downtown LA- the USA is the Security Token Summit. At the events, attendees will have the opportunity to learn more about Investment Funds and Security Tokens; Global investment, Trading, and Tokenization among other interesting topics on the agenda.
BTC/USD: 4-HR Chart
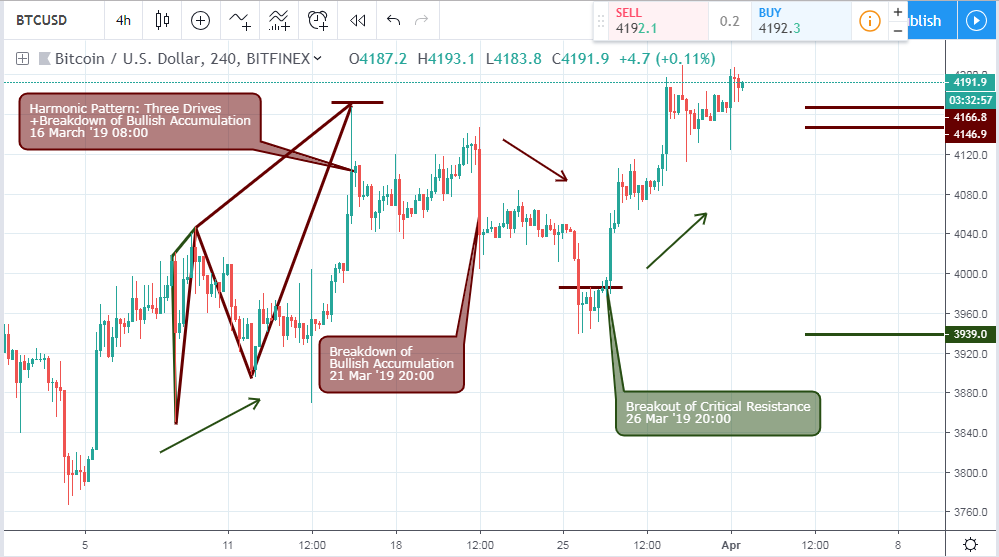
As shown on the 4hour chart, a harmonic pattern of type bearish Three Drives is indicated on March 16 ’19 08:00. The pattern was strengthened by a failure of bullish inflation in the same space as the harmonic pattern with the Bitcoin price dropping by 3.3%. Although the bearish slump did not persist, it was an opening for profit taking in a long trade and opening a sell order.
The breakout of a significant resistance level of $3980.5 launched the current bullish trend shown below.
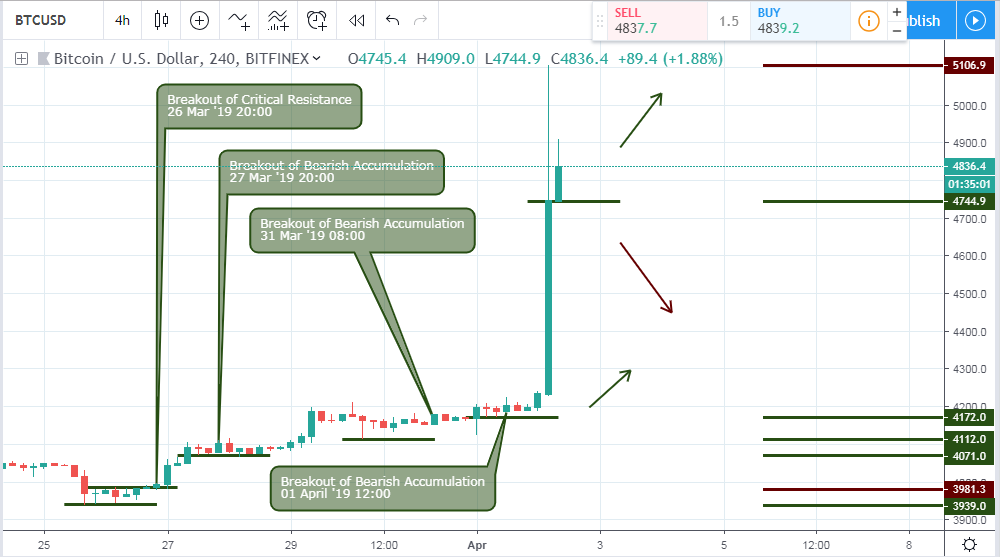
As a follow up to the 4hour analysis, the above chart shows a breakout of critical resistance, followed by a series of bearish trend rejection on March 27 ’19 20:00 and March 31 ’19 08:00, and finally into Q2 on April 02 ’19 12:00.
Conclusion and Projection
With the first quarter of 2019 coming to an end, we see an increase in speculative adoption, as all attempts from bears to continue the crypto winter was truncated by an increase in institutional and speculative demand for Bitcoin on IQ Option , a crypto platform. We look forward to a price projection of 6741.4 in the long term, so endeavor to drop by and check out or hand-vetted bitcoin brokers.

No Comments found