Bitcoin to USD ( BTCUSD ) Forecast & Weekly Analysis, October 8 2018
Bitcoin to USD Weekly Forecast & Analysis for Crypto Brokers
Introduction
Starting from the first day of October and to the end of the week, the Bitcoin to USD exchange rate has been in a rollercoaster, with bullish and bearish price action and chart patterns to support the moves. Read on to get our overview of the pair, looking back into history and moving forward.
Fundamentals
Blockchain Adoption
Coming into blockchain adoption, Israel Security Authority resorts to the blockchain technology as a way to improve their cybersecurity. Among other plans the ISA are considering implementing, are their online voting systems for investors to remotely join ISA meetups as well as a system called Magna. This blockchain solution according to a report from the Times of Israel, was developed by Taldor, an IT firm.Speculative Adoption
Based off a Bloomberg news report, the shares of Gray Scale investment plummet by 80%. Investors make reference to the high fees from the trust as well as a strongly bearish Bitcoin price.
Technical Analysis
BTCUSD: Monthly Chart

From the monthly chart of the Bitcoin to USD chart illustration above, we’ll come to notice that nothing much has changed as the pair still remains enclosed within the bearish triangle alongside the bearish accumulation pattern formed after the closing price of the month of September. The patterns formed above indicate huge bearish sentiment on the part of speculators and investors from this time horizon. On the other hand, a sudden price close above the bearish accumulation resistance level of 7337.50 signals a change in polarity and a switch from bearish to bullish sentiment.
BTCUSD: Weekly Chart
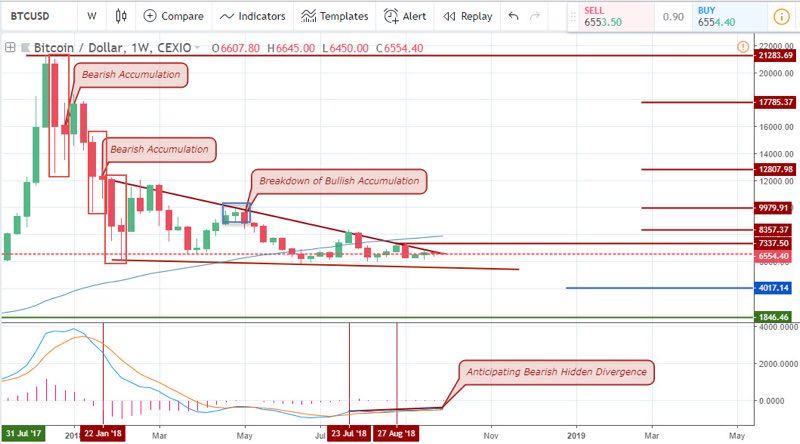
Price volatility and volume appear to be on the decline as the above weekly price chart shows small body candle bars. Not forgetting the fact that the pair has not yet broken out of a successive lower high in the bearish trend.
Another interesting one is the bearish hidden divergence pattern which we’ve been paying attention to since the previous weeks, as we patiently wait for a bearish dead cross of the MACD oscillator.
BTCUSD: Daily Chart
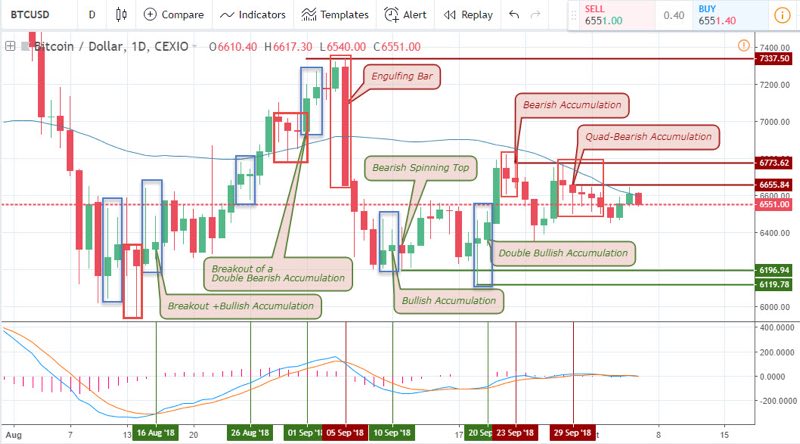
The daily price chart still remains in an oscillatory motion trading from a swing high to swing low and vice versa. It’s worth mentioning that the 19th of September was the CBOE XBT Expiration date. This fundamental event culminating with a double bullish accumulation patter lead to a bullish swing in the price of the BTCUSD as crypto brokers and traders are on the lookout for fundamental and technical pattern alignments such as these.
Moving forward to the 28th of September, no particular price action pattern was triggered. However on the 29th of September, as the month winds up to a halt, the pair triggered a bearish accumulation pattern which high lights the sentiment of traders, speculators and investors.
BTCUSD: 4-hour Chart
Still referencing the Cboe XBT Expiration date, from the 4-hourly chart, the pair triggered a huge bullish engulfing/mother bar on the 19th of September and later followed by a triple bullish accumulation pattern which confirms the bullish rally with another bullish engulfing bar and a bullish accumulation pattern.
From our last analysis of the 4-hourly chart, we observed bearish breakdowns of bullish accumulation patterns, bring us to a conclusion that a short-selling trade is worth placing at the level. Trading from these short-term time frames require deploying a trailing stop to lock in trade profits or bring a trade to break even, should there be a sudden upswing.
BTCUSD: 1-hour Chart
In order to get a clearer view of the bearish false break of the 4-hour chart, this time around, we decide to zoom in a little closer. A bullish regular divergence pattern is formed comparing the MACD oscillator to the price. As the trend intensifies, further bullish divergence patterns are triggered in the form of hidden and regular divergence patterns on 5th and 6th of October.
Conclusion and Projection
Approaching trading the BTCUSD pair from a lower time frame alone, one may be misled about the true structure of the time series chart, however, putting the higher time frames into perspective offers clear vision into the long-term bearish nature of the pair as we target the $4000.00 zone. This may take effect at the Cboe XBT Expiration date coming up on the 17th of October.
Top 3 Crypto Brokers to trade Bitcoin to USD


No Comments found