BTCUSD Weekly Outlook and Bitcoin Fundamentals , 3rd December 2020
BTCUSD Forecast and Fundamentals for Bitcoin
Introduction
Bitcoin price attains a new (ATH) All-time high on some exchanges such as Bitstamp and Binance after hitting the $19800 mark. Also, an essential driver of the number one crypto asset is the acceptance by PayPal in October.
Best Indian brokers are expected to see an increase in crypto/bitcoin adoption following a reversal of the ban on cryptocurrencies early this year.
Let’s analyze the charts for significant entry and reversal setups across multiple time horizons.
BTCUSD Technical Analysis
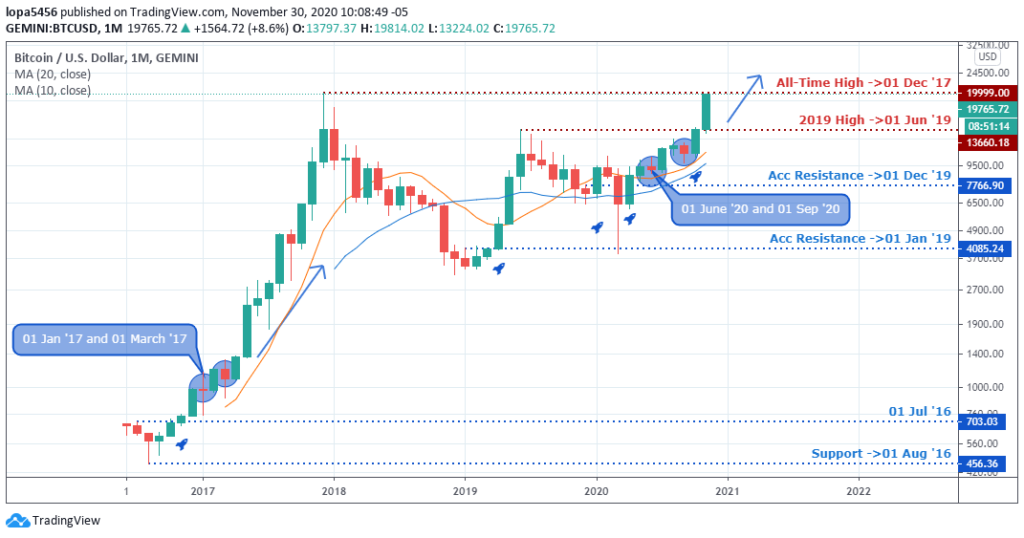
Monthly Chart

Monthly Resistance Levels: 19999.00, 20000.00
Monthly Support Levels: 13660.18
In June and September this year, the monthly chart of the BTCUSD mirrored a market structure similar to January and March 2017 when Bitcoin traded between $1400 and $700, just after the halving.
The same market structure follows the 2020 Bitcoin BTC halving, and we may see a price surge beyond the 2017 all-time high.
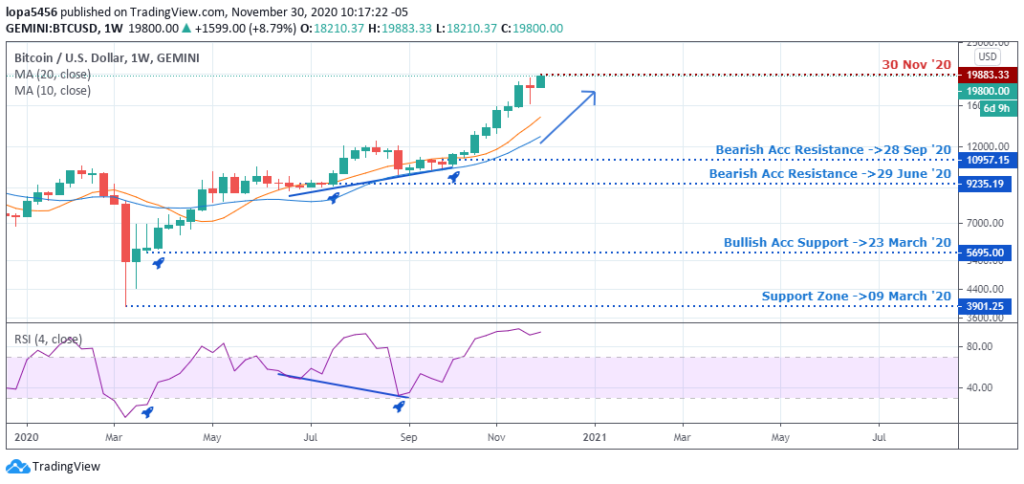
Weekly Chart

Weekly Resistance Levels: 19883.33
Weekly Support Levels: 10957.15
Last week, the BTCUSD closed bearish mainly due to a decline in miners’ revenue, and investors used the dip as a way to mop up more bitcoins BTC after a break of the $10957.15 resistance and hidden bullish divergence.
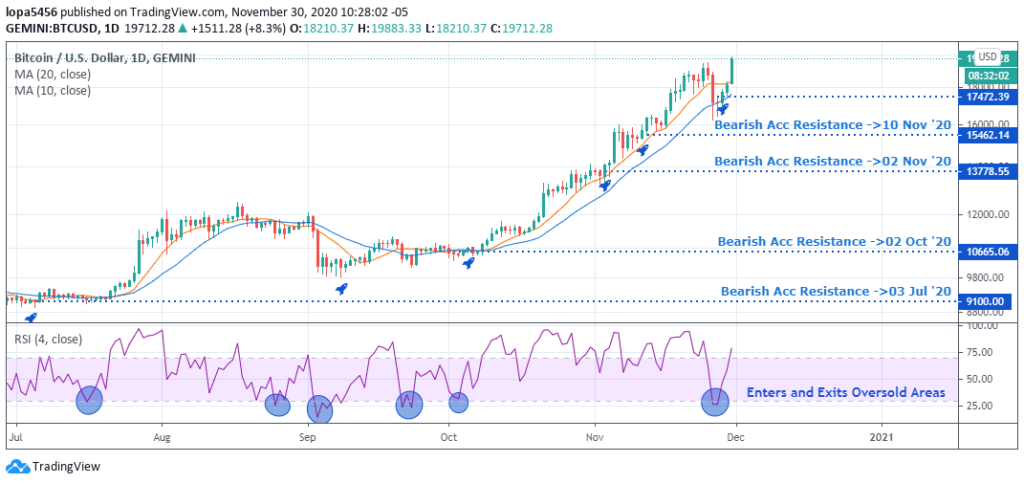
Daily Chart

Daily Resistance Levels: 19883.33
Daily Support Levels: 9100.00, 10665.06, 13778.55, 15462.14
Trend followers considered the price dip below the RSI level-30 as black Friday sales as they quickly bought Bitcoin at a discounted price.
Now setting a new high ($19940.00) above last week’s high ($19500), we anticipate a regular bearish divergence for a significant price correction, again towards the RSI level-30.
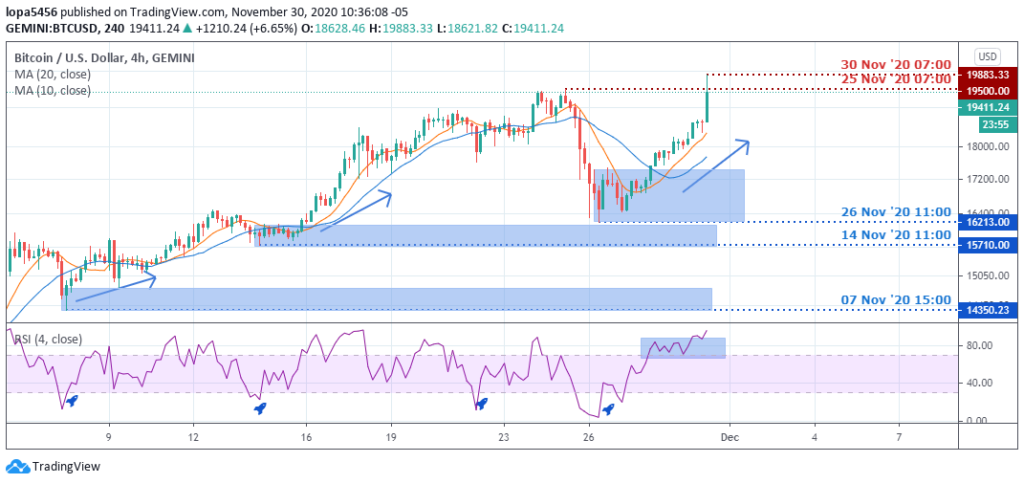
H4 Chart

H4 Resistance Levels: 19883.33, 19500.00
H4 Support Levels: 16213.00, 15710.00, 14350.23
The above H4 chart reveals the fear of missing out, as speculators and traders alike scamper to lay their hands on some BTC. Traders may consider cashing out their profit considering the pair trades above the RSI level-70.
Bullish Scenario:
As the buying frenzy heightens, we’ll instead not join to get left holding the bag. Instead, we’ll consider taking profit at the current $18500 to $19500 range.
Once the price gets within the MA-10 and 20 range (weekly TF), only then do we consider buying more into the uptrend again.
However, we may leave a fraction of our Bitcoin holdings should the price surge persist into 2021.
Bearish Scenario:
Now that the BTCUSD has cleared the significant ATH on top crypto exchanges, we may expect a price correction in the coming weeks.
Bitcoin BTC News Events
$5million in BTC is moved from the 2016 Bitfinex hack.
Bitfinex crypto exchange lost 119,756 Bitcoin (BTC) to hackers way back in 2016. Blockchain data recently revealed that 270.97974 Bitcoin out of the coins had been moved from the wallet source.
Since the breach, roughly 2% of the stolen coins have been moved in a period of 4years. The hackers appear to have been following a HODLing strategy that pays off as the coins were worth $72 million back then but are now projected to worth $2.3 billion.
Again, it may signify that the hackers have been facing challenges with moving the funds, owing to stiff regulations.
Conclusion and Projection
We’ll suggest treading carefully at the current hights of the BTCUSD and only trade a fraction of our investment, to scale in later after a price slump similar to last week Friday.
Advances in Covid-19 vaccines may also result in a correction in the Bitcoin price so be on the lookout for such news releases.

No Comments found