Bitcoin to USD ( BTCUSD ) Weekly Outlook , May 25 2019
BTCUSD Forecast and Technical Analysis & Fundamentals for Cryptocurrency
Introduction
Rising Bitcoin prices invite fraudsters to come up with malicious Apps, targeting unsuspecting cryptocurrency users. This week we’ll be looking at possibilities of the Bitcoin price, continuing the bullish trend direction and areas where buyers are exiting in profit.
Technical Analysis
BTCUSD Weekly

Upon breaking out of the RSI level-30 on December 17 ’18, the Bitcoin price comes out of oversold territory confirming an end to the crypto winter of 2018.
The RSI advanced further above the level-50 and strengthened the bullish campaign on April 01 ’19.
On May 06 ’19, the Bitcoin price on Binomo platforms enters overbought territory as the RSI crosses above the level-70 from beneath.
Beginner traders often miss the point and assume that an asset entering overbought implies an immediate change in the trend direction. Well, from experience, we see the overbought region as areas where traders can take profit from long positions, and perhaps scalp in short term long entries should the chance come upon lower time frames.
BTCUSD: Daily Chart

A daily chart overview reveals a robust bullish trend starting from a close above the RSI level-70. The price close above the bearish accumulation resistance, which was later followed by an increase in bullish pressure, sends the price rallying by about 34.82% from the breakout point.
Mid-term bitcoin holders took a considerable part of their profits which led to an exit of the RSI level-70 on May 17. After a price close above the bearish accumulation resistance, the bulls again took gains observed by a breakdown of the RSI level-70.
Below is an update to the daily chart.
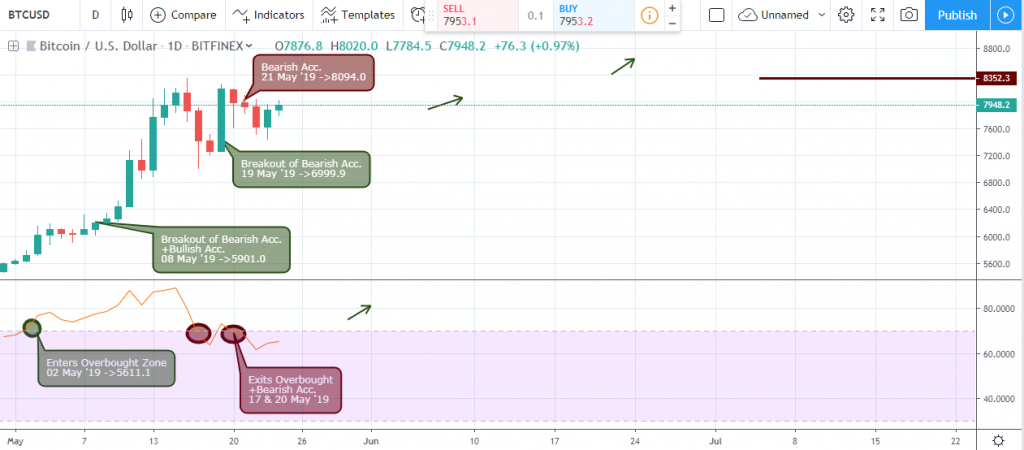
Following a second exit of the RSI overbought on May 20, a bullish Fakey pattern was signalled to highlight a strong presence of buyers in the market and a sustained bullish bias.
BTCUSD: 4Hour Chart
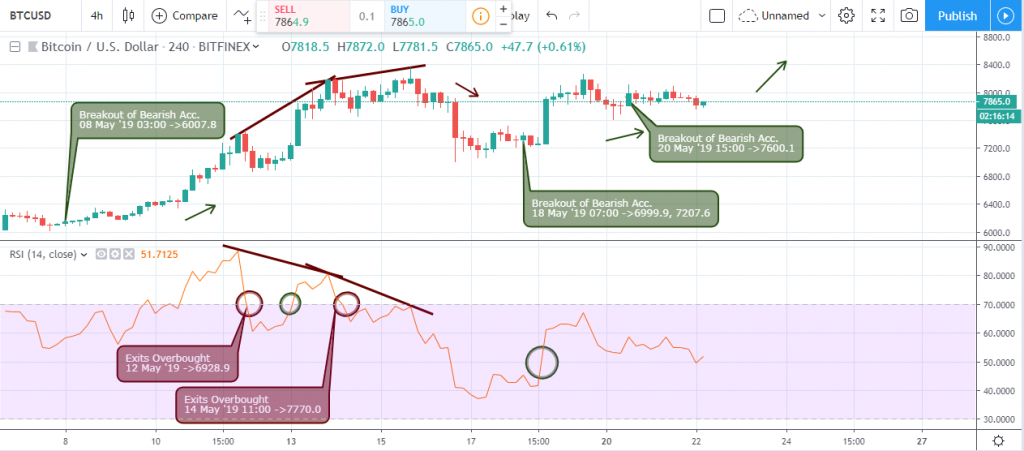
Similar to the daily chart, the 4hour time frame signals a break out of selling pressure on May 08 ’19 03:00 with support set at 6007.8.
The above 4hour timeframe offered early bullish exit signals compared to that of the daily chart as regular bearish divergence patterns were signalled on May 14 and May 16 03:00.
A setup to re-enter into the bullish trend was signalled on May 18 ’19 07:00.
Bitcoin Fundamentals
False Trezor Crypto Wallet App found on Google Play Store.
According to a claim by researchers at ESET antivirus on 23rd May, charlatans have made a move to swindle unsuspecting crypto holders by including false crypto wallets on the Google Play Store.
Among such malicious Apps, is an imitation of the Trezor hardware wallet. Such fake Apps have been designed to phish for users’ data and scam them of their money.
ESET stated that over 1000 users have these malicious Apps downloaded.
Users of crypto hardware wallets are therefore urged to only download Apps that are linked to the company’s official website.
Conclusion and Projection
While the Bitcoin price stays in overbought territory on all bitcoin broker platforms, we’ll suggest this as a call to close a good percentage of our long trades, as a break below the level-70 should signal correction of the bullish trend. However, the current hidden bullish divergence may be sufficient for keeping the Bitcoin price within the weekly charts’ overbought region.

No Comments found