USDINR – Weekly Outlook for January 10 2019
USDINR Forecast & Technical Analysis
Introduction
The USDINR currency pair hits key resistance levels on IQ Option platform, a move that may result in a mid-term recovery of the Indian Rupee.
Let’s analyze the charts and also look at this week’s fundamental drivers of the U.S. and Indian economies.
India’s Fundamentals
India Interest Rate Decision
Monetary policy decisions are any actions taken by a country’s government, the central bank, or monetary authority to achieve specific national economic goals. Policy decisions are based on the relationship between interest rates at which money can be borrowed and the total supply of money.
Changes in these indices have an impact on the growth of the economy, exchange rates, inflation, and unemployment.
A higher than expected data reading suggests economic optimism and should be considered a positive or bullish sentiment for the currency. In contrast, however, a lower than anticipated reading is seen as a negative or bearish trend for the currency.
A bearish outlook can be said to be eminent for the INR based on the latest data, which shows that the Actual and previous reading is 5.15%, while the forecast reading is 4.90%.
U.S. ADP Nonfarm Employment Change
The ADP NFP Report is a gauge of monthly variations in private employment, non-farm based on salary data of roughly 400,000 U.S. business clients.
A higher than expected data reading suggests economic optimism and should be considered a positive or bullish sentiment for the currency. In contrast, however, a lower than anticipated reading is seen as a negative or bearish trend for the currency.
A bullish outlook can be said to be eminent for the USD based on the latest data, which shows that the Actual reading is 67k, previous reading is 121k, while the forecast reading is 140K.
USDINR Technical Analysis
USDINR Long term Projection: Bullish Swing
Monthly Chart

The USDINR signals a bearish inside-bar candlestick on Dec 02 ’19 and struggles to close above Sep ’19 all-time high.
A breakdown or breakout of either the 71.754 or 70.346 resistance and support levels on this time frame would confirm further strengthening of the USD or the Indian Rupee.
Weekly Chart

From a weekly chart perspective, the pair trades within a range with significant resistance (72.424, 72.066) and support (70.194) serving as upper and lower bounds.
The above pattern is similar to the inside-bar support and resistance on the monthly chart but on a lower scale.
USDINR Medium Term Projections: Bearish
Daily Chart
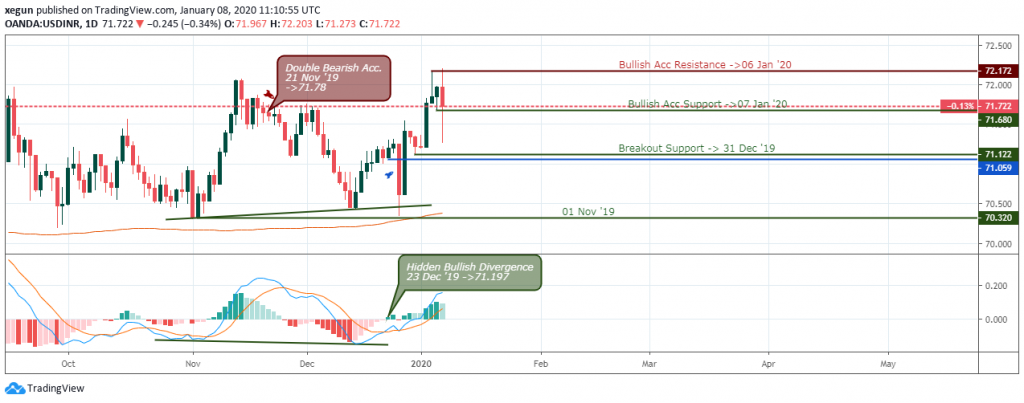
The above daily chart shows the MA-200 serving as major support that holds the USDINR from further price plunge.
Notice the hidden bullish divergence on Dec 21 ’19 that props up the price for about 1.2 from the signal level.
The bulls could not hold their levels much longer as an increase in bearish pressure later crashed the price below the key 71.68 support level.
4HR Chart
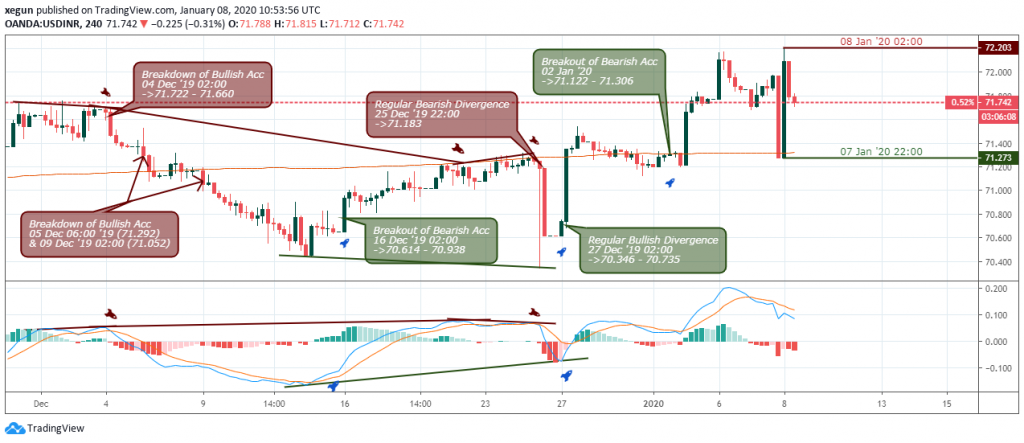
Rounding up on the 4hour time frame, a regular bullish divergence pattern on Dec 27 ’19 02:00 in combination with a breakout of key resistance level 70.615 saw the pair soaring high by about 2.0% from the breakpoint.
Conclusion and Projection
In summary, there’s no clear direction for the USDINR on the long term horizon. However, the shorter time frames offer swing trading potentials within the upper and lower bounds established on the higher time frames.

No Comments found