USD to INR – Weekly Outlook ( August 10, 2018 )
Weekly Forecast for India Brokers
Introduction
Following a steady rally on the higher time frames, the USDINR pair has entered into another market range as the weekly charts display alternating candles close in a range i.e. previous weekly closing prices are followed by opposite directional close in the next. It’s been a roller coaster, and only time will tell if the technical setups we’ll be considering will play out, considering the trade wars going on between the United States and China.
Fundamentals events of the United State dollar and the Indian Rupees
In the news and on Twitter, is President Donald Trump, saying that his steep tariffs on imports of goods from China are becoming more effective than anticipated by anyone else. He continued by mentioning that Beijing is in trade talks with the United States.
According to Andre Bakhos of New Cines Capital LLC, the S&P has been in a gradual climb even in the midst of trade concerns and tensed geopolitical climates. Also, a news report from Reuters mentioned that the NASDAQ, propped by the tech companies like Apple, Amazon, and Microsoft is trading firmly higher than the Dow and S&P 500.
INDIA VIX
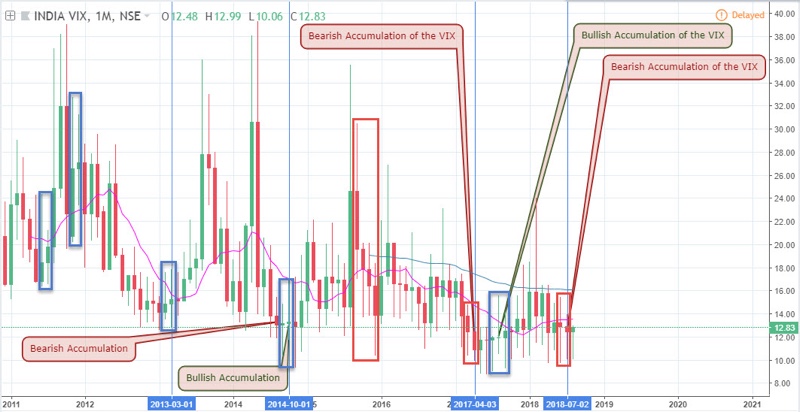
The chart below is India’s VIX chart, which measures market volatility from the best bid-ask price of Nifty Options contracts. In the nearest months, the VIX is in a bearish accumulation phase which implies a decline in market volatility. A breakout of this bearish accumulation or formation of a bullish accumulation at the bottom of a volatility decline would imply further highs in the USDINR pair.

Gold Price Plummets
A fall in the price of Gold in Asian countries makes the dollar stronger, and consequently making it expensive for Indian and Chinese buyers, couple with a USD to INR exchange rate.
Technical Analysis
As usual, we’ll be taking a top-down approach to analyzing the time series data. Starting from the monthly chart, and working our way down to the 2-hourly charts.
USDINR Monthly Chart

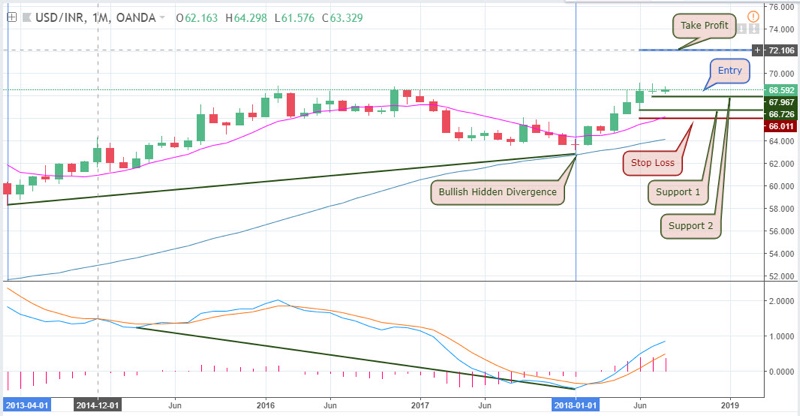
The monthly chart is still in a consecutive series of bullish candles following a bullish hidden divergence on 01-01-2018. From this time frame alone, it’s clearly obvious the pair has a high probability of establishing new highs, as a double bullish accumulation pattern is formed on 02-07-2018, 01-06-2018, and 01-05-2018. This, in particular, is the kind of setup we always look out for in the market, as it aligns with our idea of trend following.
USDINR Weekly Chart

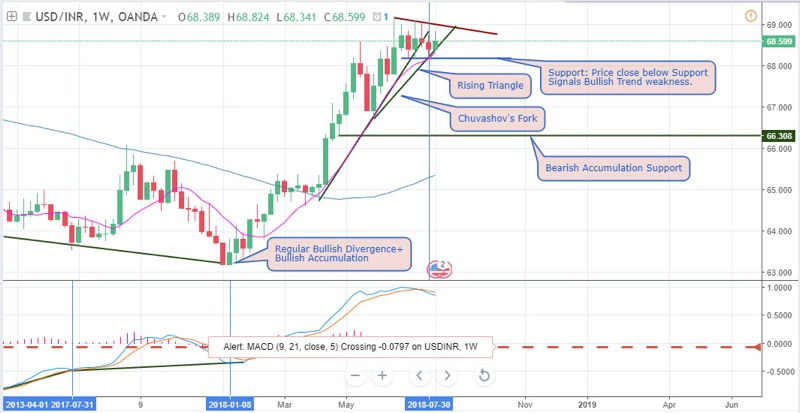
The weekly chart represents a very clear break down of the consecutive bullish candles of the monthly chart! This is exactly what we are looking for, as the trend is further broken down, allowing for clear entry points. This allows us to identify the dips, and take our positions accordingly. From the attached chart above, the weekly bars have been in alternating range for the past 4-weeks now.
USDINR Daily Chart: Bullish Divergence

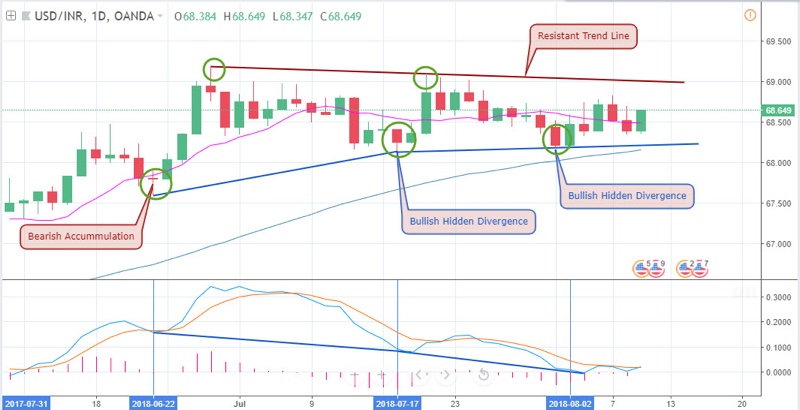
The daily chart highlights the weekly charts sideways market, as bullish hidden divergence signals are triggered on the 17-07-2018, and 02-08-2018. Right now, we can only wait for a bullish bar close above the trend-line resistance as confirmation of the bullish trend.
4-Hour (H4) Time Frame
Here on the 4-hourly chart is where we get to see a breakdown of the activities for this week. It shows the rollercoaster pattern formed this week, starting from the 5th, where the breakout of a bearish accumulation pattern is formed. Later another failure of another accumulation pattern is formed. This time, it’s a bullish accumulation pattern that failed, sending price tumbling down mid-week to 68.341. Getting closer to the weekend, the price started rising again using the previous bearish accumulation low as a support level at 68.366.
2-Hour Time Frame
As usual, we take on the 2-hourly chart last, and it shows a further break down of the 4-hourly time series chart. It’s been the same rollercoaster pattern flow, with a bearish accumulation pattern formed at the peak of a midweek swing. This sends price tumbling down to support where an opposing bullish accumulation pattern was formed at the bottom of the downswing.
Projection and Conclusion
If you’ve read this post up to this point, and if you’ve been following our previous posts, you might already see where our bias is coming from. We are still very bullish on this pair and will take setups that support the bullish trend of the monthly candles. Moving forward into the next week, we expect the price to continue to the upside as we believe India brokers and traders alike are in the same direction. On the other hand, a failure of the bullish accumulation support on the monthly chart signal a change in the market trend and hence the strength of the Indian Rupees.
Top 3 India Forex Brokers to trade India Brokers


No Comments found