USD to INR – Weekly Outlook ( September 13, 2018 )
Weekly Forecast for India Brokers
Introduction
With a lot of bearish sentiment towards the S&P 500, NASDAQ, the Dow and consequently the United States dollar following Sino-U.S trade wars, hopes of a recovery in strength of the Indian rupees increases.
India’s Fundamentals
Most Indian stocks closed higher on Wednesday with gains coming in from the Metals, Fast moving consumer goods, and Capital Goods sectors. The best performers were Adani Port and Special Economic Zone Ltd, and Power Grid Corporation of India Ltd.
India 50 Daily Charts

The daily chart of India50 shows price bouncing off the 65-period moving average, even before reaching making contact with it. A bullish inside bar price action formation signals an end to the bearish retracement from the highest high.
India’s Gross Domestic Product
It’s a known fact that the GDP of any nation is a measure of her economic health, as a higher than expected reading is considered bullish for the Indian rupees. A recent release on 31st of August came with an actual value of 8.2%, forecast of 7.6% and previous being 7.7%. This implies a stronger Indian rupee; therefore any sign of weakness on the part of the U.S dollar should boost the strength of the Indian rupees.
Technical Analysis
Though the fundamentals may be favorable to the Indian economy, jumping into a Short selling order immediately without proper house keeping with a technical analysis is often time suicidal and peculiar to new and inexperienced traders.
USDINR Monthly Chart
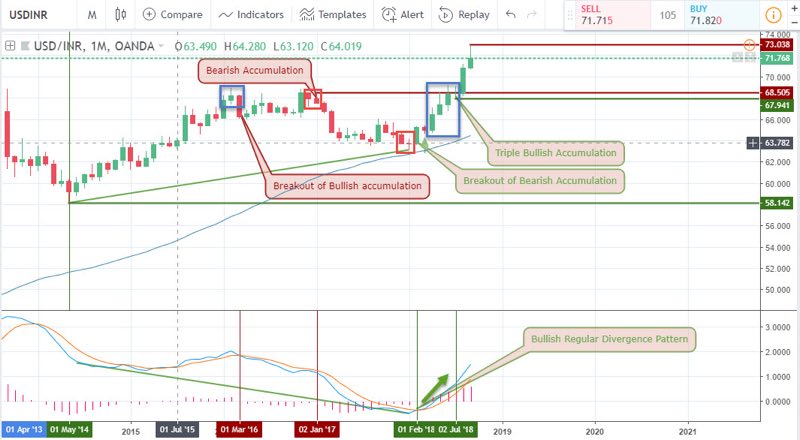
Similar to our last outlook of the USD to INR exchange from a monthly time horizon, nothing much has changed other than the month of August closing bullish with a very small candles wicks. This indicated possibilities of new highs in the month of September. A little correction from our last article, it was actually a triple bullish accumulation on 2nd of July that further triggered the new highs in August and September, coupled with an earlier formed bullish hidden divergence pattern on the 1st of February.
USDINR Weekly Chart
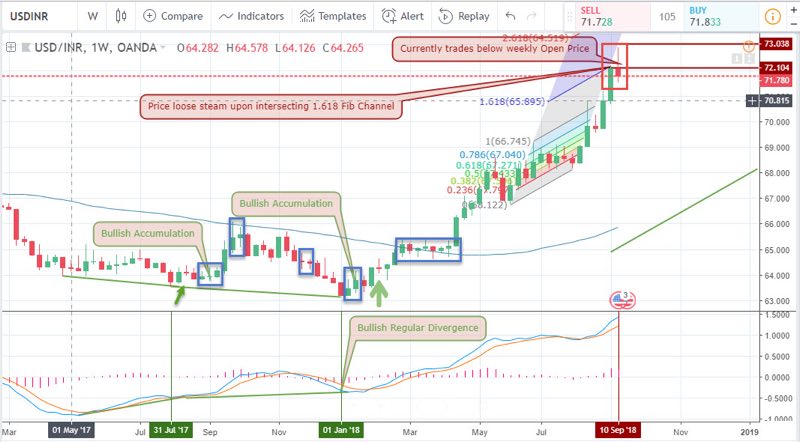
In a rising bullish or bearish trend freely flowing without any countering resistance or support, it may be tough finding a reversal point, which is why we take to deploying a Fibonacci channel here to give a clue on possible reversal or slowing points in the form of resistance levels. Looking at the Fib-channel above, the 1.618 level offered resistance at 72.104 upon price intersection. This level may lead to a complete directional change in the pair’s trend or just a mere slowing.
USDINR Daily Chart: Bullish Divergence
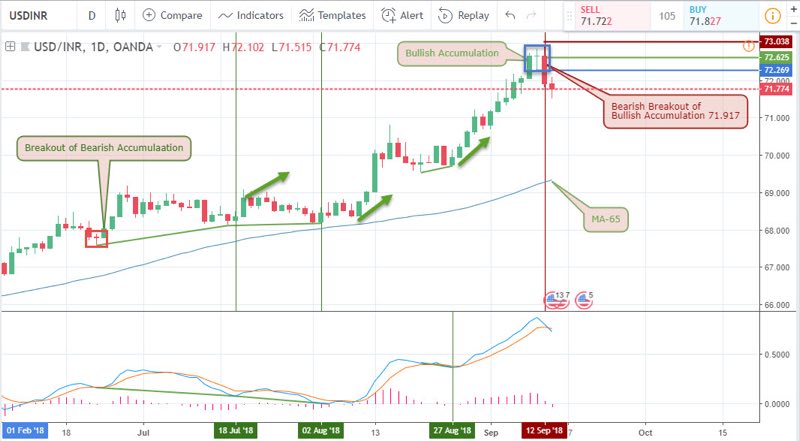
Considering that higher time horizons such as the monthly and weekly chart have not shown any convincing price action pattern, we take to the daily and other lower time frames for a clearer view. From the above daily chart, we notice the formation of a bullish price accumulation, which failed signaling a strong bearish breakout pattern on the 12th of September.
From this point we decide to enter a short selling trade at the opening price on the 13th, with our stop loss placed above the bullish accumulation resistance at 73.038. Take profit in this case is discretionary and we consider deploying a trailing stop.
4-Hour (H4) Time Frame
A view of the 4-hourly chart gives a clearer outlook of the pair, getting us in early into a short-selling trade as price violates a bullish hidden divergence by closing below its support at 72.285 around the London open on the 12th September. Also observe the bearish regular divergence patterns formed on 11th September and 12th September, the latter being the straw that finally breaks the camel’s back!
2-Hour Time Frame
The 2-hourly chart above is quite similar to the 4-hourly chart in the area of bearish divergence patterns and failure of bullsih hidden divergence patterns . Also, notice the failure of the bullsish accumulation pattern ate the same point of the regular bearish divergence patterns. Moving forward from the bearish divergence pattern, a double bearish accumulation pattern is further trigger to buttress the bearish trend flow.
Projection and Conclusion
The week continued with the bullish trend direction established from the previous week, but switched to bearish direction on the lower daily, 4-hourly and 2-hourly charts of the pair. This has led to a sudden change in order flow amongst India brokers and traders alike, with high probability of continuing into the new week. Check out our brokers section for a recommendation on India brokers.
Top 3 India Forex Brokers to trade India Brokers


No Comments found