USDINR – Weekly Outlook & Analysis for 18th June 2021
USDINR Forecast & Technical Analysis for Forex
Introduction
Forex platform like IQ Option will experience high volatility during the trading week as market participants await the Fed’s statement and news conference on Wednesday which will direct the state of the major currency.
During this meeting, the Fed speakers will shed some light on U.S policy settings based on their previous meeting of April since a sizeable number of the minority were open to the tapering bond purchases.
India’s Fundamentals
The Indian rupee is under pressure as the second wave of coronavirus cases are on the high in Indian compared to other Asian counties like Singapore and Taiwan which passed through the first wave of the COVID-19 relatively unscathed but are now facing higher numbers of infection cases which have forced the government to impose tighter restrictions on people’s movement.
US Fundamentals
The U.S dollar has been showing strength recently as online brokers and other market participants apply caution to trading ahead of the two days policy meetings of the Federal Reserves. Traders wish to find clues concerning their decision on tapering the bond purchases.
However, Jerome Powell highlighted the point that rising inflationary pressures are transitory and Ultra-easy monetary settings will be stable for a while unless the recent developments from the economic data show an increase in price pressure which could lead to an early stimulus withdrawal.
Investors and online brokers hope to get clues of the Feds decision from the outcome of the manufacturing survey and U.S retail Sales when the report comes out.
Retail Sales m/m
The report is based on the total value of sales that was measured at the retail level within a certain period. The data usually has a higher impact on the forex platform because the consumer spending data is seen at the earliest state with a broader outlook.
This data accounts for the majority of the overall economic activity within the period.
An outcome that is greater than the forecast is good for the country’s currency while a lower than expected will mean a bearish move for the currency.
The previous data was 0.0% while the forecast is -0.6%
USDINR Technical Analysis
Long term Price Analysis
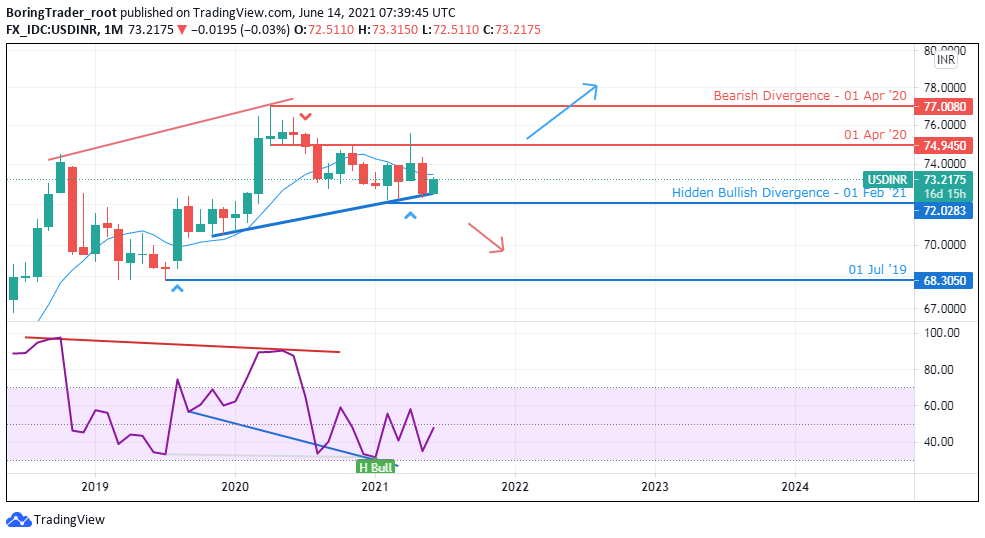
Monthly Outlook: Trades within correction area

Monthly Resistance Levels: 77.00, 76.00, 74.950
Monthly Support Levels: 72.00, 68.30,
The USDINR has been trending within the resistance of 74.950 and the support zone of 72.000 since the year began. The sellers were in control of the market since the pandemic having traded to the low of 72.00. A close below the zone will take the price to the lower low of 68.30 levels.
A possible move for an uptrend is building up as we can see that the stochastic indicator is in an oversold region for a possible bullish surge to the resistance of 74.950. A close above the resistance level will take the price of the USDINR pair up to the next resistance levels of 77.00.
Weekly

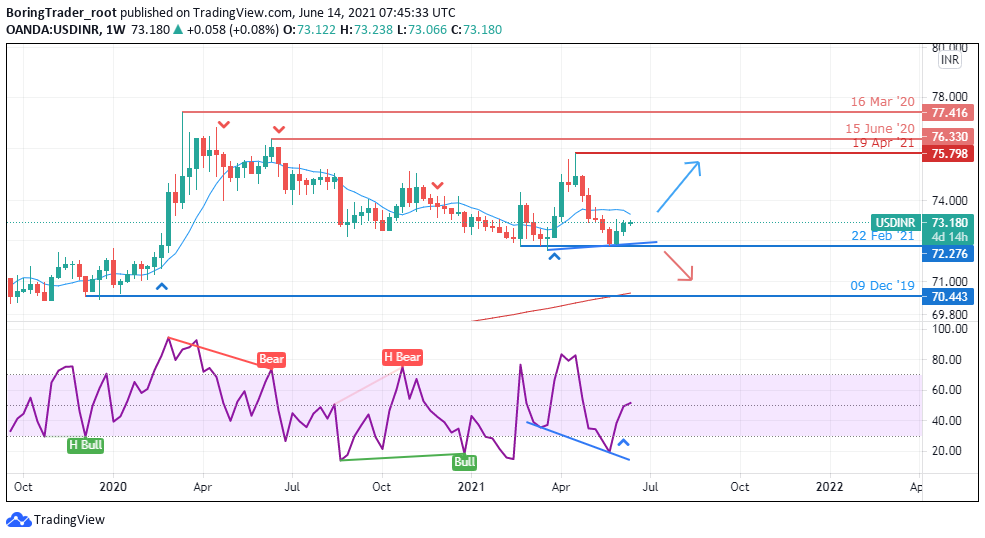
Weekly Resistance Levels: 75.798, 76.330, 77.416
Weekly Support Levels: 72.276, 70.443
On the weekly time frame, we can see that selling pressure on the USDINR pair increased since last year when the pair failed to go past the resistance levels of 76.330 and 77.416.
The Indian rupee had been stronger than the US dollar since the COVID-19 crisis, having seen a general fall of economic activities in the world. If the short position traders can close below the 72.276 support level, we shall see the price drop to the low of 2019 December, (70.443).
However, should the support levels of 72.276 holds, you will see the long position traders take the pair up towards the 75.798 zones, a breakout of the zone will take the price higher to the high of 2020 (77.416).
Daily Projections: Breakout of Descending Triangle

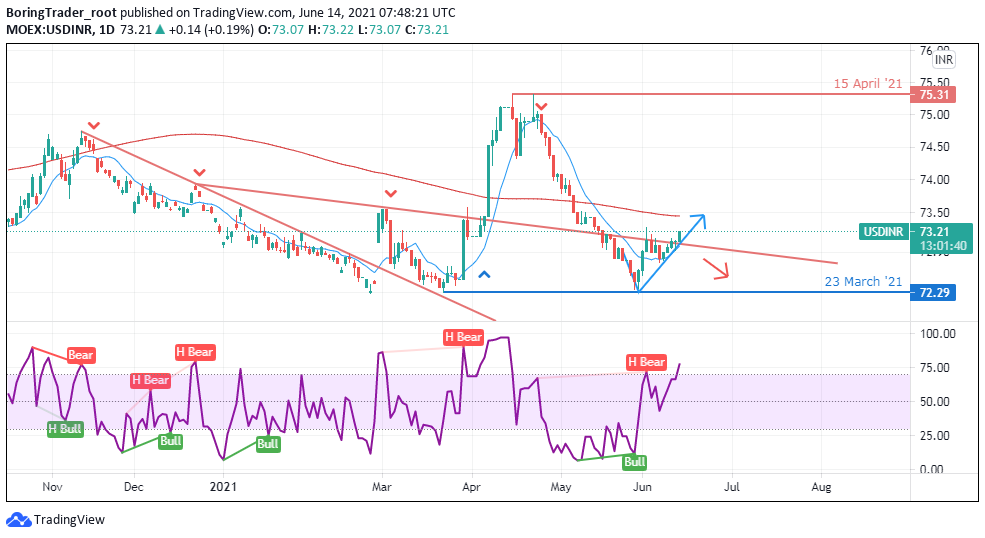
Daily Resistance Levels: 73.50, 74.50, 75.31
Daily Support Levels: 72.30
On the Forex platform, you can see that there is a breakout from the descending triangle for an upward movement.
The uptrend movement is likely to reach the high of the 75.31 resistance zones if the momentum is strong. The short position traders will have to wait for the price to reach the 75.31 level for the price to reach base on the market sentiments, if the Bulls should close above the zone the uptrend continues.
The high of 75.31 is a psychological zone for the traders, a strong bearish rejection will probably push back the bulls rally for a downtrend.
The week is an interesting trading week because market participants cannot find out the mind of the Fed members to know what is pressing on their mind which will point to the direction for their decisions.
Bullish Scenario:
Looking at the Daily chart, the trading week is going to start on a bullish note as we can see that the Bulls have broken out from the trend line on the daily high for an upward trend. We expect the momentum to continue for the week.
Bearish Scenario:
The Bears may have to wait till the price gets to the high of 75.31 before they can take action base on the market sentiment as to when the price reaches the zone. However, nothing is certain in the market, the trend could change before the price gets to the resistance zone.
Conclusion and Projection
As the new trading week is likely going to be a bullish beginning, most traders expect a favourable outcome of advance retail sales from the US economic calendar.
However, the Fed meeting is of importance to the market participant because they need to know which aspect of the economic activity weighs more on the minds of the Federal Reserve members.

No Comments found